
 Register
 Login
Login Register


Gold Pulls Back, Silver Retests History: Is the Precious Metals Super Cycle Still Alive?

Ludmila Insaurralde >
Senior Market Analyst
Ludmila Insaurralde >
Senior Market Analyst
 Updated Tue, 2026 July 21 08:15

Gold and silver are facing one of their biggest tests of 2026.
Normally, rising geopolitical tensions would support safe-haven assets. However, the latest escalation between the United States and Iran has created a very different market environment.
That has pushed Treasury yields and the U.S. dollar higher, creating pressure on non-yielding assets such as gold and silver.
As a result, gold has suffered its biggest weekly decline in six weeks, while silver has fallen to around eight-month lows.
Gold’s Long-Term Cycle: Consolidation, Breakout and the First Major Retest
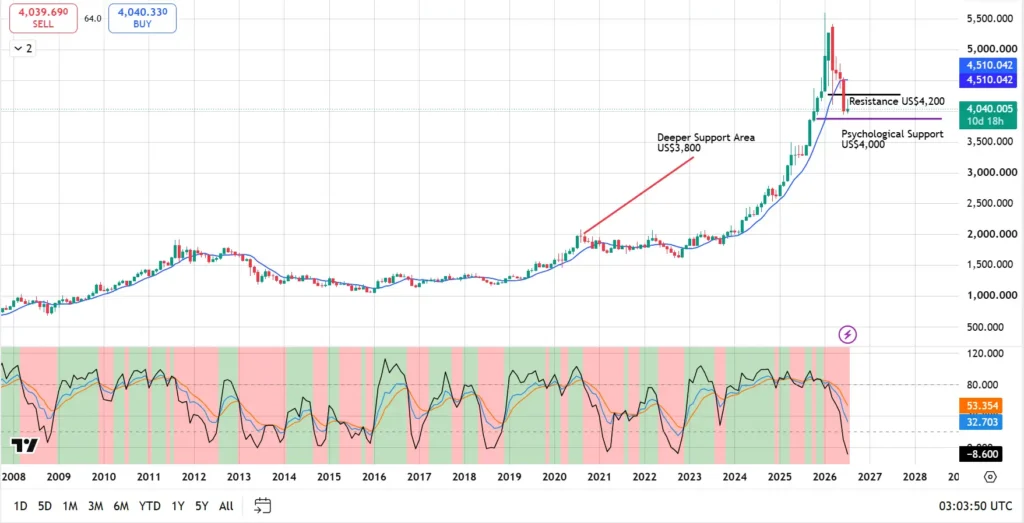
Gold is trading around US$4,000 after correcting more than 25% from its early-2026 record above US$5,600. The long-term chart shows a recurring pattern of major peaks, deep corrections, prolonged consolidation and eventual breakouts into price discovery.
The 2011–2020 period formed a broad rounded base, followed by a multi-year consolidation between 2020 and 2024. Gold then broke above its historical US$2,000–US$2,075 resistance zone and entered an accelerated price-discovery phase.
The current correction represents the first major test of that breakout cycle. Holding around US$4,000 could support the view that gold is consolidating within a longer-term structural advance, while a sustained break lower could increase comparisons with the multi-year downturn that followed the 2011 peak.
What traders are watching:
- Gold has been testing the psychologically important US$4,000 area following its recent decline.
- Rising U.S. Treasury yields remain a key headwind for the non-yielding metal.
- A stronger U.S. dollar could continue to limit upside momentum.
- Softer inflation data could provide support if markets reduce expectations for further Fed tightening.
From a super-cycle perspective, the current decline does not necessarily invalidate the broader long-term trend.
One of the key questions is whether gold can establish a sustainable base following the correction. Continued consolidation around major long-term support zones could indicate that the market is absorbing the earlier rally rather than reversing the entire cycle.
Silver (XAG/USD): The 45-Year Technical Story Everyone Is Watching
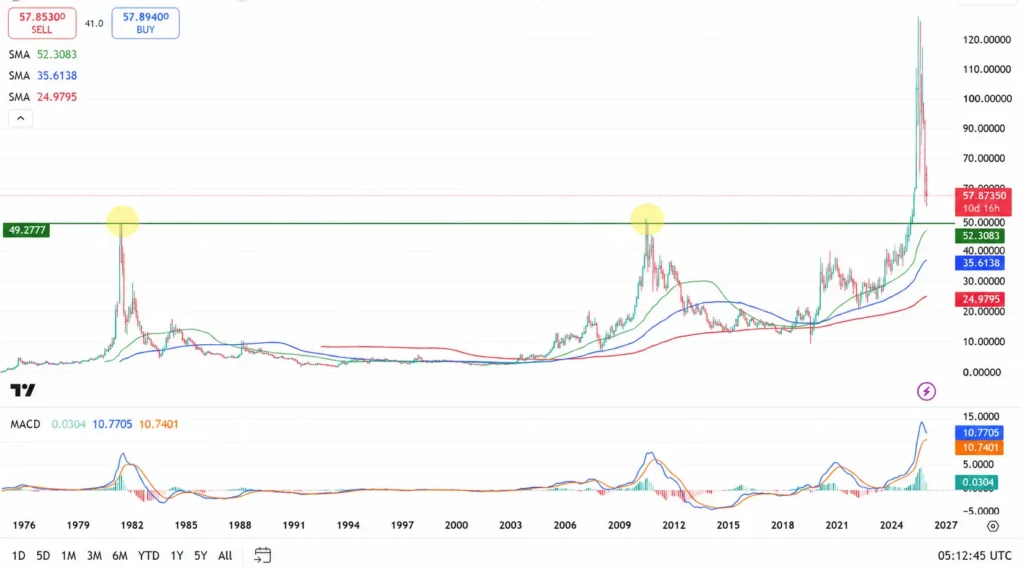
Silver recently fell below US$56 per ounce, reaching its weakest level since late 2025. It has since recovered toward US$58, but remains sharply below its January 2026 record above US$115 and is still down approximately 20% year to date. On the surface, the move appears bearish. But long-term technical traders often view markets differently.
The 45-Year Silver Structure
To understand why the current area matters, investors need to zoom out to 1980.
Silver reached close to US$50 per ounce during the historic rally of that year. More than three decades later, it returned to almost the same level in 2011 before once again reversing sharply.
Those two peaks created a long-standing resistance area around US$48–US$50.
When viewed on a multi-decade chart, some technical analysts interpret the structure as an enormous cup-and-handle formation:
- 1980: left side of the cup and first historic peak.
- 1980–2011: multi-decade rounded recovery.
- 2011: return to historical resistance.
- 2011–2025: extended handle and consolidation.
- 2025–2026: breakout above the old US$50 ceiling.
- 2026: major acceleration followed by the current correction.
The interpretation is not universally accepted, but the technical principle behind it is straightforward: After a market breaks through major historical resistance, it will often return to test the breakout area.
Gold vs Silver: Two Different Super-Cycle Stories
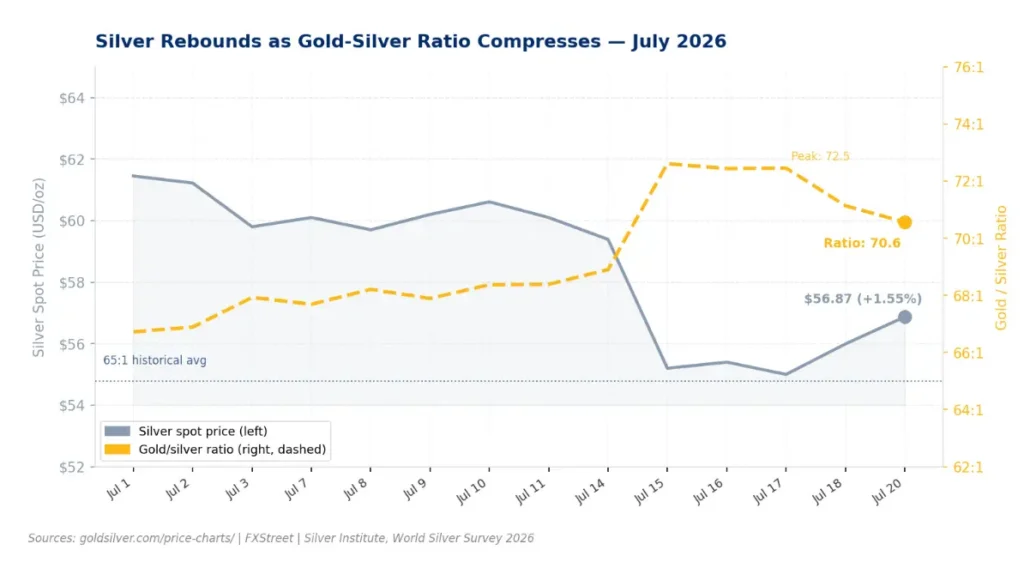
Although gold and silver often move together, they are driven by different forces. Gold remains primarily influenced by central banks, interest rates, inflation expectations and geopolitical uncertainty. Silver shares many of those characteristics…
But it also behaves like an industrial metal, that makes silver potentially one of the biggest beneficiaries if the broader commodity super-cycle thesis continues to develop.
What Could Drive the Next Move?
Several major themes could determine where precious metals head next.
• Federal Reserve policy.
• Inflation.
• Treasury yields.
• Oil prices.
• The U.S. dollar.
• Geopolitical developments.
• Continued central-bank gold buying.
• Industrial demand for silver.
Disclaimer: The material provided here has not been prepared in accordance with legal requirements designed to promote the independence of investment research and as such is considered to be a marketing communication. Whilst it is not subject to any prohibition on dealing ahead of the dissemination of investment research we will not seek to take any advantage before providing it to our client. No representation or warranty is given as to the accuracy or completeness of this information and therefore it shouldn’t be relied upon as such. Any research provided does not have regard to specific financial situations, needs or investment objectives. Vantage accepts no responsibility for any use that may be made of these comments and for any consequences that result. Consequently, any person acting on it does so entirely at their own risk. We advise any readers of this material to seek professional advice where necessary. Without the approval of Vantage, reproduction or redistribution of this information isn’t permitted.
-

Open Trading Account
Discover the endless trading possibilities with our cutting-edge platform, designed to empower our traders. Practice trading the markets with a free demo account today.
-

Download Vantage App
Trade on the go with the Vantage All-In-One Trading App, where smooth execution and market access come together in the palm of your hand.
-

Start Trading
Are you an existing user? Login to your account to start trading 1,000+ CFD products including forex, indices, gold, shares and more.
