
 Register
 Login
Login Register


RBA Preview: Is the Long-Awaited 25bp Cut About to Drop?

Hebe Chen >
Senior Market Analyst
Hebe Chen >
Senior Market Analyst
 Updated Mon, 2025 August 11 05:00

As the Reserve Bank of Australia heads into its August policy meeting, scheduled for August 12, 2025 market focus is zeroing in on whether the data finally clears the bar for the long-awaited rate cut.
Key Takeaways:
- What did the RBA signal at the July meeting?
- What has the data shown since then?
- What are the key watchpoints for the August decision?
- How has the AUD responded recently?
What Did the RBA Signal at the July Meeting?
In July, the RBA surprised markets by holding the cash rate steady—despite a 98% chance of a cut priced in beforehand. Governor Michele Bullock emphasised that the pause wasn’t a pivot but “a pause with purpose,” noting the Board is “not ruling anything in or out” and making it clear the bar for any move—up or down—is now materially higher.
What has the data shown since then?
The economic data released since the July meeting has nudged the RBA closer to action.
The June quarter CPI delivered the clearest case yet for a cut. Trimmed mean inflation—a core measure closely watched by the RBA—eased to 2.7% year-on-year, down from 2.9% in March. That puts underlying inflation comfortably back within the RBA’s 2–3% target band for the first time in over three years. Importantly, services inflation—historically the most persistent driver of inflation—has continued to moderate across most categories.
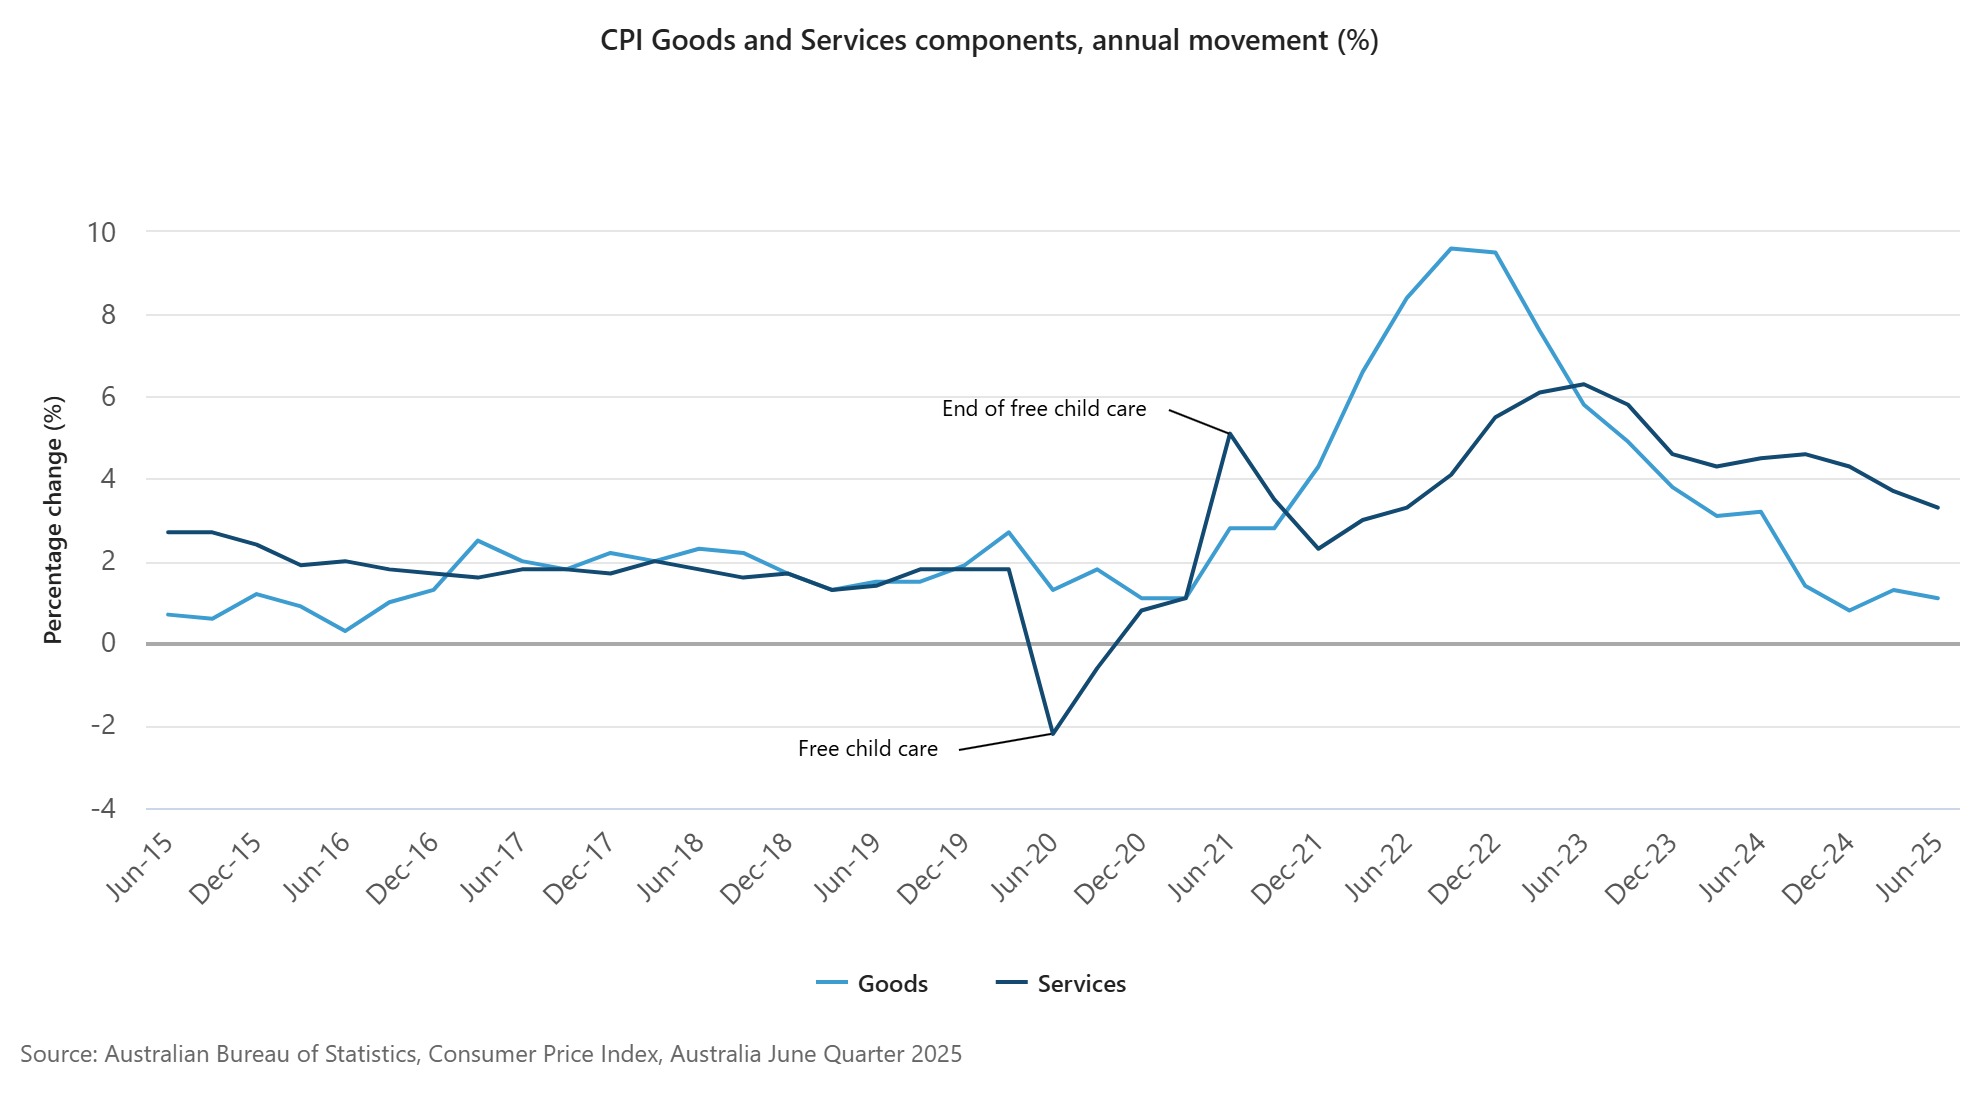
On the employment front—the RBA’s other key mandate—early signs of softening are beginning to emerge. While the labour market still looks solid at a headline level, the unemployment rate edged up to 4.3% in June, the highest since Nov 2021. It’s not a red flag yet, but it adds to a broader picture of cooling, with job vacancies and hours worked also slipping.
In short, the inflation risk has clearly stepped down, while labour market data is flashing yellow. With global uncertainty also rising, the RBA now has the macro cover it needs to consider a move.
What are the key watchpoints for the August RBA decision?
Likely Move: 25 bps Cut
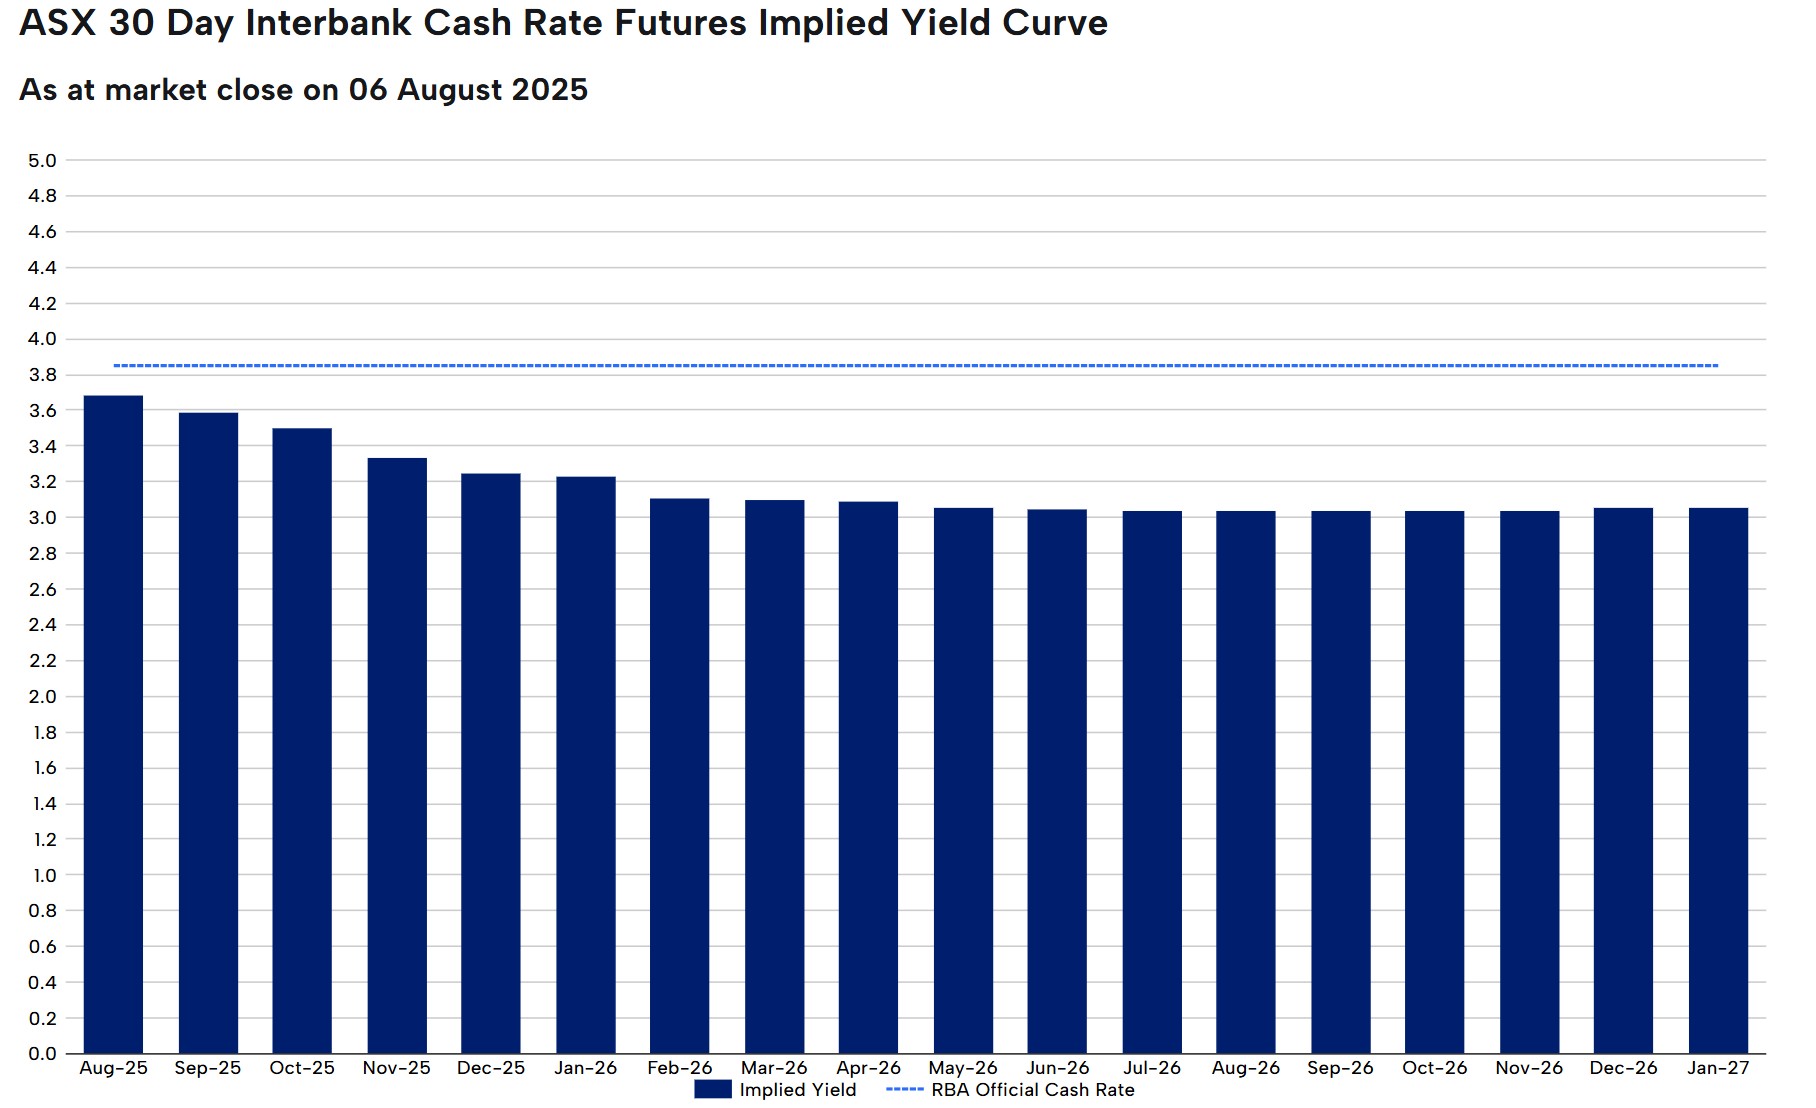
Markets are now cautiously leaning toward a 25 basis point cut, with odds priced at 51% a week ahead of the meeting. The rate curve also reflects rising expectations of further easing—potentially lowering the cash rate to 3.25% by year-end and to 3% by mid-2026.
Statement on Monetary Policy (SMP)
Also landing on decision day is the RBA’s Statement on Monetary Policy—a key document that provides forward guidance. Markets will dissect this for updated inflation forecasts, growth assumptions, and any new language around downside risks. The August SMP will likely shape expectations not just for this meeting, but for the next few quarters.
AUD/USD Outlook
The Australian dollar has been on the defensive, largely due to a resurgent greenback fuelled by the Fed’s hawkish tone. However, the tide may be turning soon.
Recent soft US inflation data, combined with growing speculation that Trump’s pick for Fed chair will be pro rate-cut, has injected fresh volatility into the USD outlook. If the Fed turns more dovish and global yields compress, the AUD could start clawing back ground.
There’s also a wildcard in play: U.S. tariffs. Any escalation—particularly with China—could ripple through commodity markets, hitting demand and weakening the Aussie. On the flip side, a truce or delayed action could provide support.
AUD/USD Technical Highlights
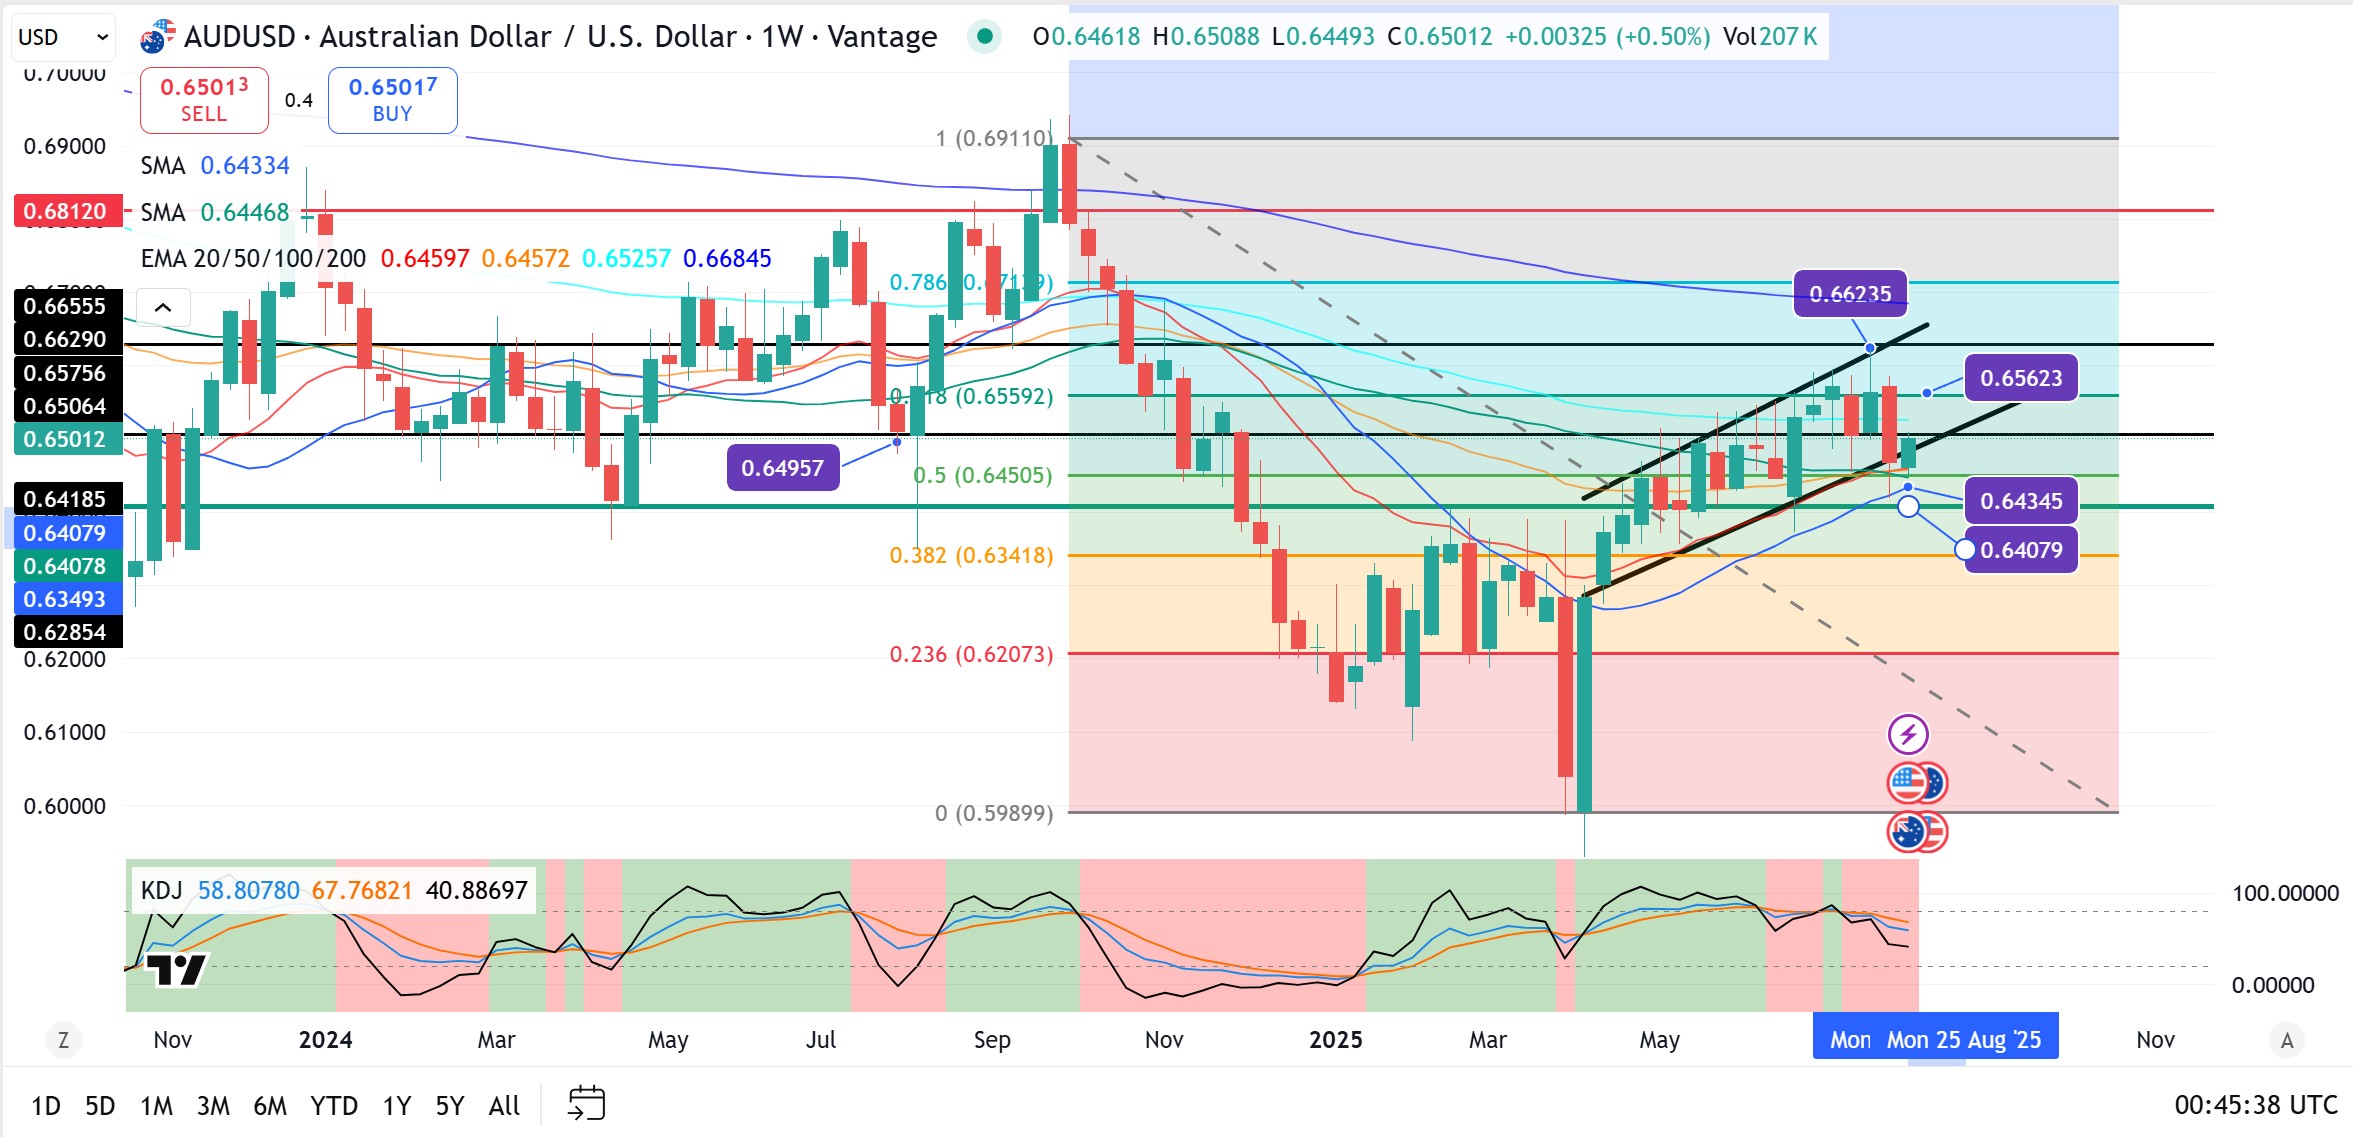
- The pair continues to trade within a short-term ascending channel (black lines), but is struggling to break the upper range near 0.6560–0.6620.
- The weekly close above 0.6500 keeps the bullish structure intact, but any sustained failure at resistance could trigger a pullback.
- Fib retracement from 0.5989 to 0.6911 defines key zones:0.6559 (78.6%) and 0.6623 (upper resistance) mark the next upside hurdles.0.6450 (50%) and 0.6341 (38.2%) serve as layered supports on the downside.
- The 20- and 50-week EMAs (0.6525 & 0.6457) are converging, creating a short-term pivot zone.
- Momentum (KDJ): The KDJ oscillator shows a mild bearish divergence —This suggests fading momentum and reinforces the need for a clean breakout above 0.6620 to reignite upside momentum.
Disclaimer: The material provided here has not been prepared in accordance with legal requirements designed to promote the independence of investment research and as such is considered to be a marketing communication. Whilst it is not subject to any prohibition on dealing ahead of the dissemination of investment research we will not seek to take any advantage before providing it to our client. No representation or warranty is given as to the accuracy or completeness of this information and therefore it shouldn’t be relied upon as such. Any research provided does not have regard to specific financial situations, needs or investment objectives. Vantage accepts no responsibility for any use that may be made of these comments and for any consequences that result. Consequently, any person acting on it does so entirely at their own risk. We advise any readers of this material to seek professional advice where necessary. Without the approval of Vantage, reproduction or redistribution of this information isn’t permitted.
-

Open Trading Account
Discover the endless trading possibilities with our cutting-edge platform, designed to empower our traders. Practice trading the markets with a free demo account today.
-

Download Vantage App
Trade on the go with the Vantage All-In-One Trading App, where smooth execution and market access come together in the palm of your hand.
-

Start Trading
Are you an existing user? Login to your account to start trading 1,000+ CFD products including forex, indices, gold, shares and more.
