
 Register
 Login
Login Register


How does Middle East tensions ripple through Australian markets?

Hebe Chen >
Senior Market Analyst
Hebe Chen >
Senior Market Analyst
 Updated Thu, 2026 March 5 09:56

The escalation between the United States, Israel, and Iran is surely not a distant geopolitical footnote.
For Australian investors watching this unfold from the other side of the world, the temptation is to treat it as background noise — a geopolitical flare-up that will eventually burn itself out. History, and the last 72 hours of price action, says otherwise. The shockwaves from the Gulf are already moving through oil futures, the US dollar, and equity markets across Asia. The question is no longer whether Australian markets will feel the impact. It is how deeply, and for how long.
Impact Layer One: Oil Prices and the USD
The Strait of Hormuz is the world’s most consequential shipping chokepoint. Around 20% of global oil and a similar share of LNG normally transit this narrow waterway daily. Any disruption — or even the credible threat of one — immediately triggers a supply-risk premium across energy markets. Brent crude has already extended gains to around $82.76 per barrel, 30% higher since the first day of 2026.
The USD dimension complicates the picture. The US Dollar Index has climbed toward 99.40 — its highest level since December — as flight-to-safety flows reinforce the greenback’s reserve currency status. A stronger USD tightens global financial conditions and acts as a headwind for dollar-denominated commodity prices, creating an offsetting drag that investors should not overlook.
Impact Layer Two: Inflation and the RBA
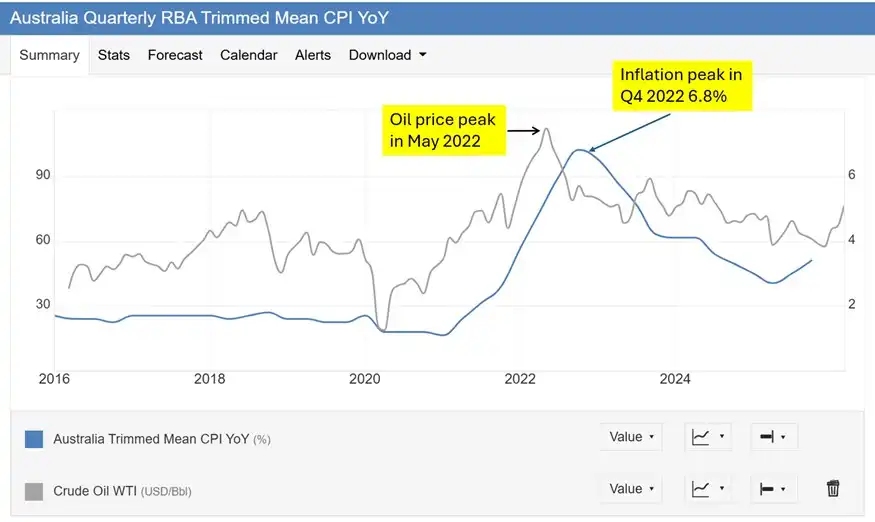
A sustained oil shock does not stay in the commodity aisle — it bleeds into transport, logistics, food production, and ultimately inflation. That is the RBA’s predominant concern right now.
Source: Trading economics
The RBA’s position has shifted noticeably this week. Governor Michele Bullock has warned that an oil price shock could reignite domestic inflationary pressures, and has signalled the March policy meeting remains “live” for a potential rate increase. The probability of a hike in May is now pushing toward 80% — a remarkable repricing in the span of days.
Impact Layer Three: The Economy and Equities
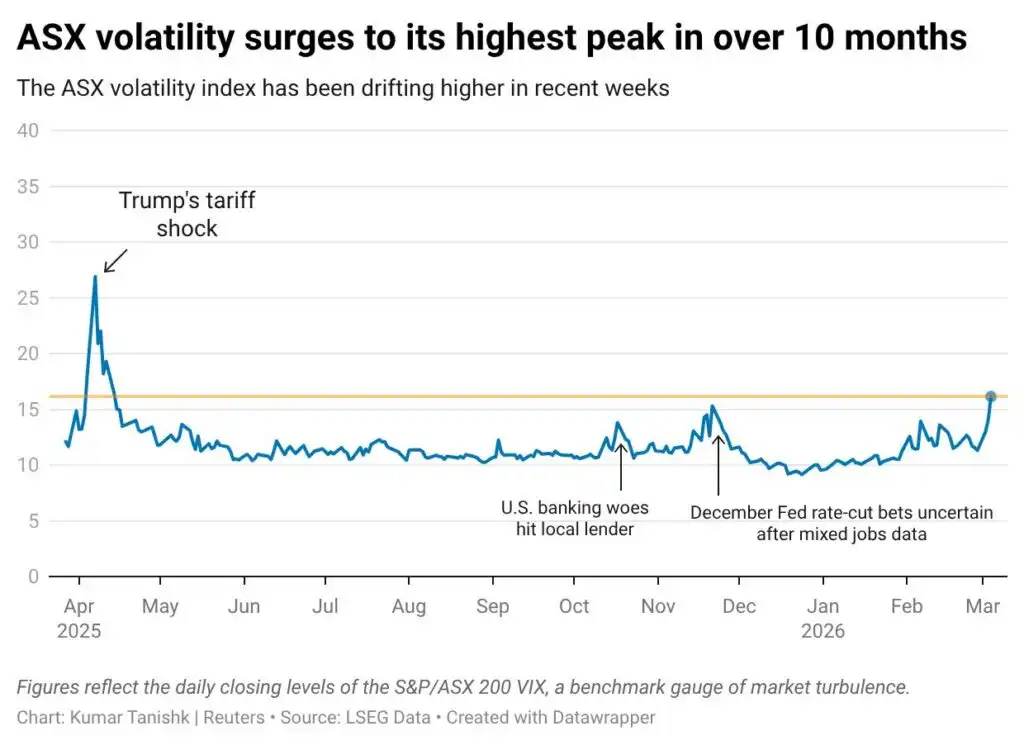
The ASX 200’s response this week illustrates the sector divergence that defines energy-shock environments. Energy stocks surged — Woodside Energy climbed 6.8% and Santos gained 6.7% on Monday — while mining heavyweights BHP, Rio Tinto, and Fortescue slid between 2.4% and 4.5% as risk-off sentiment broadened. Gold names initially rallied before pulling back sharply as the USD firmed. The broader index has since retreated from record highs to below 8,920, with implied volatility rising to a 10-month high.
The macro overlay is the critical context here.
A higher-for-longer RBA cash rate, layered on top of elevated energy costs and softening consumer sentiment, is not a benign backdrop for rate-sensitive sectors — financials, REITs, and consumer discretionary in particular. The bifurcation between energy beneficiaries and rate-sensitive laggards is likely to persist as long as the conflict remains unresolved.
Technical Analysis: AUD/USD
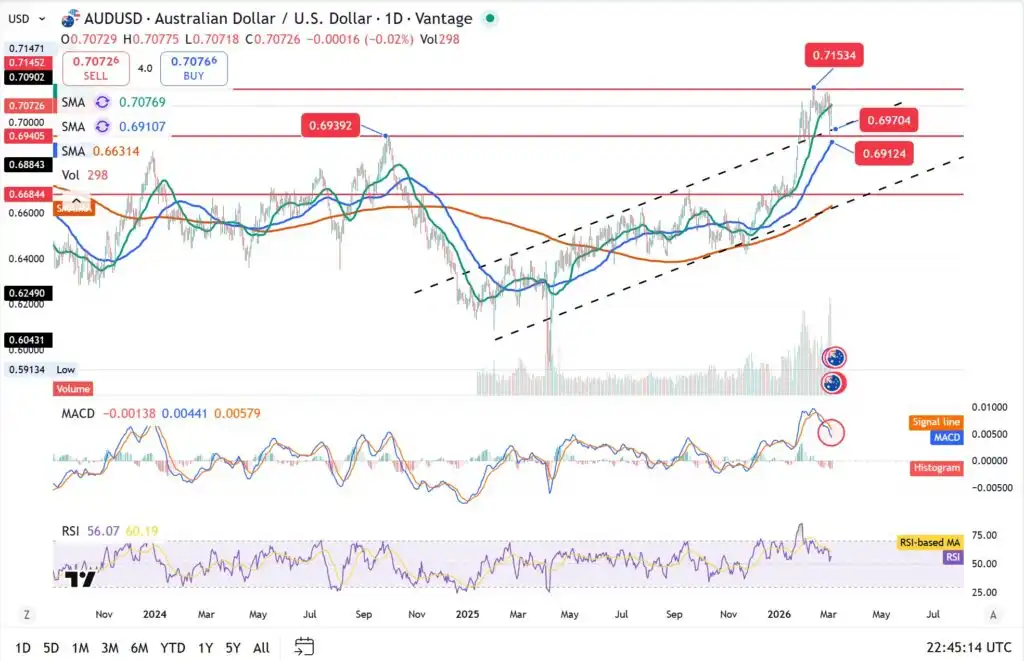
AUD/USD has broken below the 20-day SMA support level, now trading around the previous resistance-turn-to-support near 0.6939, pressured by safe-haven USD demand amid the US–Israel–Iran conflict. The next meaningful support sits at 0.6912; a reclaim of 0.7100 requires either de-escalation or a Fed policy shift. Momentum indicators has pivoted as shown in the RSI bearish cross. This looks like a sentiment-driven consolidation, any relief rallies should be treated with caution.
Technical Analysis: ASX 200
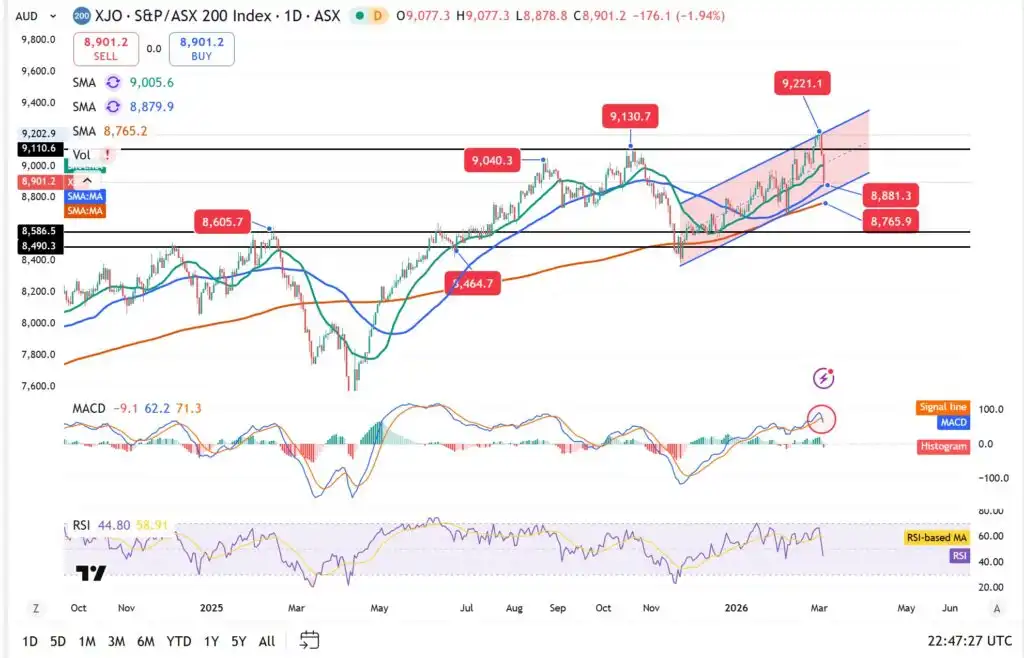
The ASX 200 has retreated from its record high of 9,201 to below 8,920, with near-term support at 8,765 – 8,881 now in focus. Energy remains the clear sector outperformer. A sustained recovery toward prior highs requires oil price stabilisation or geopolitical de-escalation. Without that catalyst, the path of least resistance is lower — sector selection, not index positioning, is where the opportunity lies.
Disclaimer: The material provided here has not been prepared in accordance with legal requirements designed to promote the independence of investment research and as such is considered to be a marketing communication. Whilst it is not subject to any prohibition on dealing ahead of the dissemination of investment research we will not seek to take any advantage before providing it to our client. No representation or warranty is given as to the accuracy or completeness of this information and therefore it shouldn’t be relied upon as such. Any research provided does not have regard to specific financial situations, needs or investment objectives. Vantage accepts no responsibility for any use that may be made of these comments and for any consequences that result. Consequently, any person acting on it does so entirely at their own risk. We advise any readers of this material to seek professional advice where necessary. Without the approval of Vantage, reproduction or redistribution of this information isn’t permitted.
-

Open Trading Account
Discover the endless trading possibilities with our cutting-edge platform, designed to empower our traders. Practice trading the markets with a free demo account today.
-

Download Vantage App
Trade on the go with the Vantage All-In-One Trading App, where smooth execution and market access come together in the palm of your hand.
-

Start Trading
Are you an existing user? Login to your account to start trading 1,000+ CFD products including forex, indices, gold, shares and more.
