
Gold, oil, bonds rise as stocks trade mixed ahead of US CPI
Jamie Dutta >
Market Analyst
Jamie Dutta >
Market Analyst

Headlines
* Iran tensions grow as US sends carrier, missile submarine to Middle East
* Yen dips, markets stabilise ahead of US inflation data
* Stocks wobble as traders struggle to build on last week’s comeback
* Safe haven demand lifts gold to highest in 10 days
FX: USD was virtually flat on the day, ahead of top tier data this week, including CPI on Wednesday and retail sales on Thursday.
EUR halted four straight days of losses as prices tried to consolidate above 1.09. This could be bullish consolidation before a move above 1.0950, though the long-legged doji on Thursday last week could disrupt that pattern.
GBP pushed up to a high of 1.2793 before paring gains below the 50-day SMA. It’s a very busy week of UK data with wage growth, CPI, GDP and retail sales all released through this week.
USD/JPY printed a high of 148.22 before pulling back but still settling higher on the day. The reversal in the safe haven yen was due to heightened geopolitics with reports Iran could attack Israel in less than 24 hours.
AUD tried to break higher but found resistance around the 100-day and 200-day SMAs at 0.6595 and 0.6601. The kiwi outperformed, capturing the 0.60 handle ahead of the RBNZ rate decision on Wednesday. Money markets price in a 75% of a 25bps rate cut. But consensus is more mixed. USD/CAD moved very modestly higher after six days of selling in a row. The weekly chart showed a bearish key reversal after closing below the prior week’s low.
US Stocks: US markets closed mixed with individual stock weakness offset by tech outperformance. The benchmark S&P 500 closed flat at 5,344. The tech-dominated Nasdaq 100 finished up by 0.16% at 18,542. The Dow Jones settled 0.36% lower at 39,357. The VIX, Wall Street’s fear gauge, just about finished lower for a third consecutive day just above 20. Tech, energy and utilities were the only sectors in the green. Major consumer-related stock, Home Depot, an important indicator for consumer spending in big ticket items, reports its result on Tuesday with Walmart on Thursday. Tesla finished lower on reports it has halted orders for the $61,000 base model of its Cybertruck.
Asian stock futures are positive. Asian stocks were mostly higher after light news flow over the weekend, and to kick off a busy week. The ASX 200 was in the green led by tech and telecoms. The Nikkei 225 was closed for a holiday. The Hang Seng and Shanghai Composite were both muted in relatively quiet trade.
Gold jumped over 1.6% as safe haven demand on Middle East jitters got bugs excited. Prices are closing in on the record high at $2483. Treasury yields fell as bonds went bid with the 10-year falling back to 3.90%. Gold, as a non-interest bearing asset, is more attractive when yields fall.
Day ahead – UK Employment data
The UK jobs market has been slowing, similar to others around the world. This trend is expected to continue in the June data, with a further rise in the unemployment rate to 4.5%, and another fall in vacancies. The former has been subject to data collection issues so its reliability is still questioned.
For pay growth, base effects come into play in June which are forecast to reduce the annual rate noticeably from the prior ex-bonuses print of 5.7%. Momentum in wages should act as a guide to whether the weaker demand picture is delivering wage disinflation. The BoE slightly de-emphasised pay growth as a driver of its decision-making at its August meeting. But it still remains a meaningful input for the committee which was very split on the first rate cut of the cycle at the start of August.
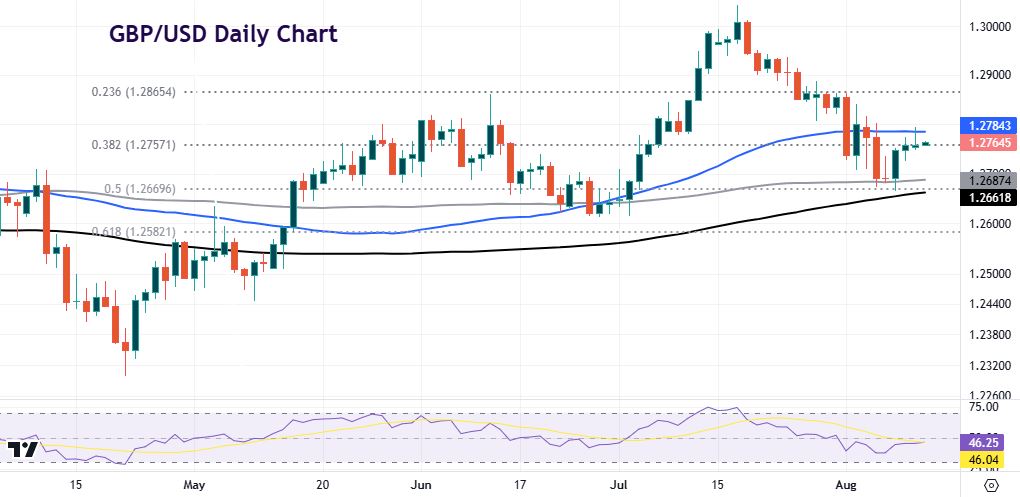
Chart of the Day – GBP/USD at the mercy of this week’s data
Sterling has a lot of data to contend with this week with figures released from tomorrow onwards until Friday. Note that we do get another jobs and CPI report ahead of the September BoE meeting. We did hear from the MPC’s Mann who said UK wage growth is still a concern for inflation and wage pressures could take years to dissipate. She is a well-known hawk at the bank and is still concerned about upside risks to inflation, though she has softened her stance marginally with the slide in inflation.
If this week’s UK data shows strength in the economy, cable should break decisively above a Fib retracement level (38.2%) of the April to July move at 1.2757 and the 50-day SMA at 1.2784. The next minor Fib level sits at 1.2865. Support below resides at the 100-day, 200-day SMAs and the halfway point of the recent four-month move around 1.2661/87. This will be challenged if the eocomny looks to be rolling over.
Disclaimer: The material provided here has not been prepared in accordance with legal requirements designed to promote the independence of investment research and as such is considered to be a marketing communication. Whilst it is not subject to any prohibition on dealing ahead of the dissemination of investment research we will not seek to take any advantage before providing it to our client. No representation or warranty is given as to the accuracy or completeness of this information and therefore it shouldn’t be relied upon as such. Any research provided does not have regard to specific financial situations, needs or investment objectives. Vantage accepts no responsibility for any use that may be made of these comments and for any consequences that result. Consequently, any person acting on it does so entirely at their own risk. We advise any readers of this material to seek professional advice where necessary. Without the approval of Vantage, reproduction or redistribution of this information isn’t permitted.
-

Open Trading Account
Discover the endless trading possibilities with our cutting-edge platform, designed to empower our traders. Practice trading the markets with a free demo account today.
-

Download Vantage App
Trade on the go with the Vantage All-In-One Trading App, where smooth execution and market access come together in the palm of your hand.
-

Start Trading
Are you an existing user? Login to your account to start trading 1,000+ CFD products including forex, indices, gold, shares and more.
