
 Register
 Login
Login Register


Gold After the Shock: Why the Bull Case Survives a Historic Selloff

Hebe Chen >
Senior Market Analyst
Hebe Chen >
Senior Market Analyst
 Updated Thu, 2026 February 5 06:00

Gold’s first four weeks of 2026 were a vertical fever dream. After a gravity-defying rally that saw prices surge nearly 25% to trade beyond $5,400/oz, the metal ran head-first into one of its most brutal sessions on record — its worst single-day selloff since the early 1980s.
For market participants, the real question is whether this shock marks a terminal turning point for the bull market — or simply a reset that opens the door to a fresh dip-buying opportunity.
2025 Review
2025 was a landmark year for gold. Total global demand — including over-the-counter transactions — surpassed 5,000 tonnes for the first time on record, reflecting an unprecedented convergence of investor, institutional and official-sector demand.
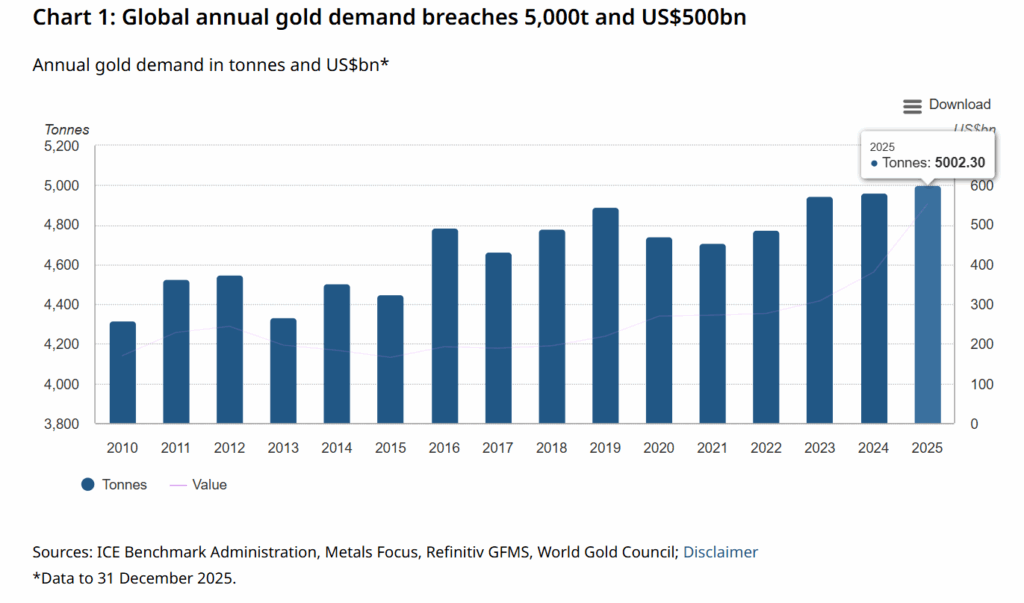
Investment demand was the dominant driver. According to the World Gold Council, ETF inflows surged to around 800 tonnes, bar and coin demand reached a 12-year high, and central banks maintained robust reserve accumulation.
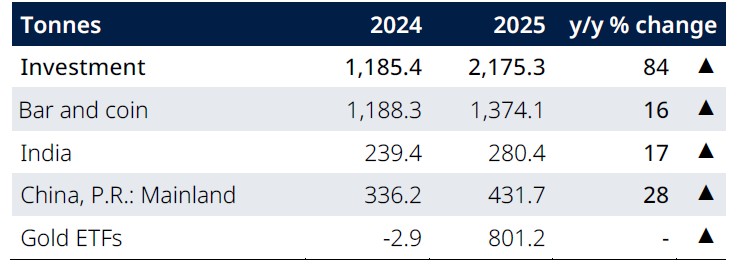
Source: World Gold Council, data up to 31 December 2025
Supported by this powerful demand mix, gold prices notched 53 all-time highs during the year as safe-haven allocation and diversification themes intensified. The total value of global gold demand climbed to an estimated US$555 billion, up roughly 45% year-on-year, underscoring both elevated investor conviction and gold’s expanding strategic role amid macro uncertainty.
Forecasts for Gold Prices in 2026
Institutional forecasts continue to reflect strong conviction that gold’s structural bull case remains intact, despite heightened volatility:
- J.P. Morgan: Targets prices around $6,300/oz by end-2026, citing sustained central-bank demand and rising investor allocations.
- Goldman Sachs: Raised its year-end 2026 forecast to $5,400/oz, driven by diversification demand and safe-haven flows.
- UBS: Upgraded its outlook toward the $6,200/oz range, highlighting stronger-than-expected investment demand.
Across the street, forecasts cluster broadly between $5,000 and $6,600/oz, with variations largely reflecting assumptions around rate cuts, geopolitical stress and the durability of investor flows.
2026 So Far
Gold entered 2026 with strong momentum, buoyed by elevated geopolitical tensions, firmer U.S. rate-cut expectations following jobs and inflation data, and persistent safe-haven demand.
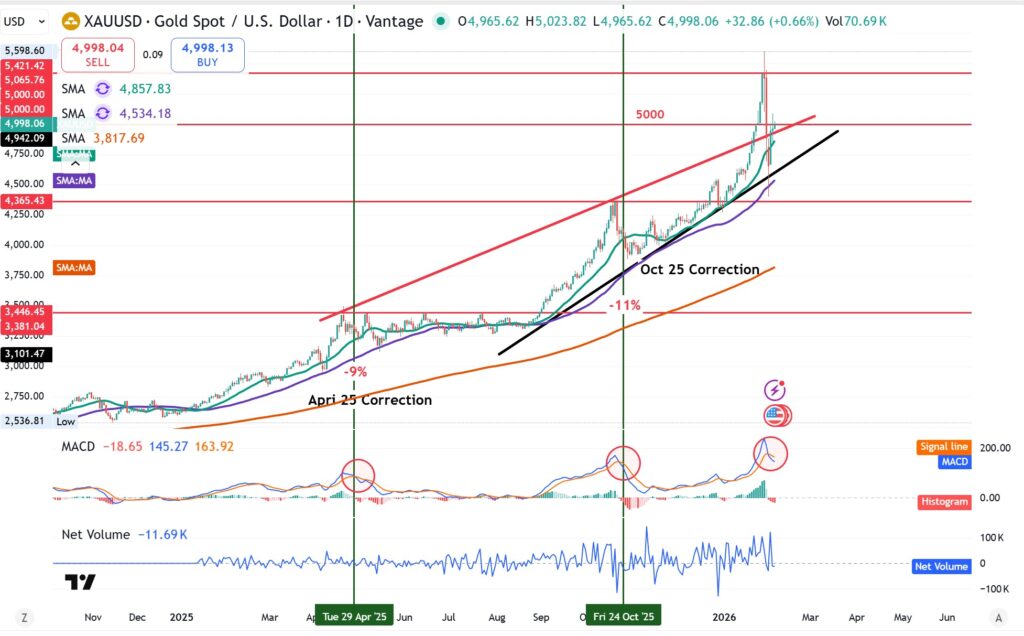
Source: Trading view
That momentum was abruptly interrupted late in January, when the market absorbed a violent correction following the nomination of Kevin Warsh as the next Federal Reserve chair. Viewed as comparatively cautious on easing, the nomination triggered a sharp reassessment of the policy outlook, strengthened the U.S. dollar and set off a liquidity-driven selloff in precious metals.
What’s Changed — and What Hasn’t
- Geopolitical risk: Tensions across multiple fronts — including U.S.–EU trade friction, Iran, Russia–Ukraine and U.S.–China — show little sign of resolution, with several flashpoints sitting close to renewed escalation.
- Debasement and reserve diversification: Central banks remain active buyers as confidence in fiat stability is tested. Questions around central-bank independence — particularly as the Fed enters a leadership transition with Chair Jerome Powell’s term ending in May — continue to weigh on the long-term dollar outlook.
- Rate expectations: While Warsh’s nomination triggered short-term repricing, broader expectations for monetary easing remain largely intact. Futures markets continue to price two to three rate cuts in 2026, with growing conviction around cuts beginning mid-year.
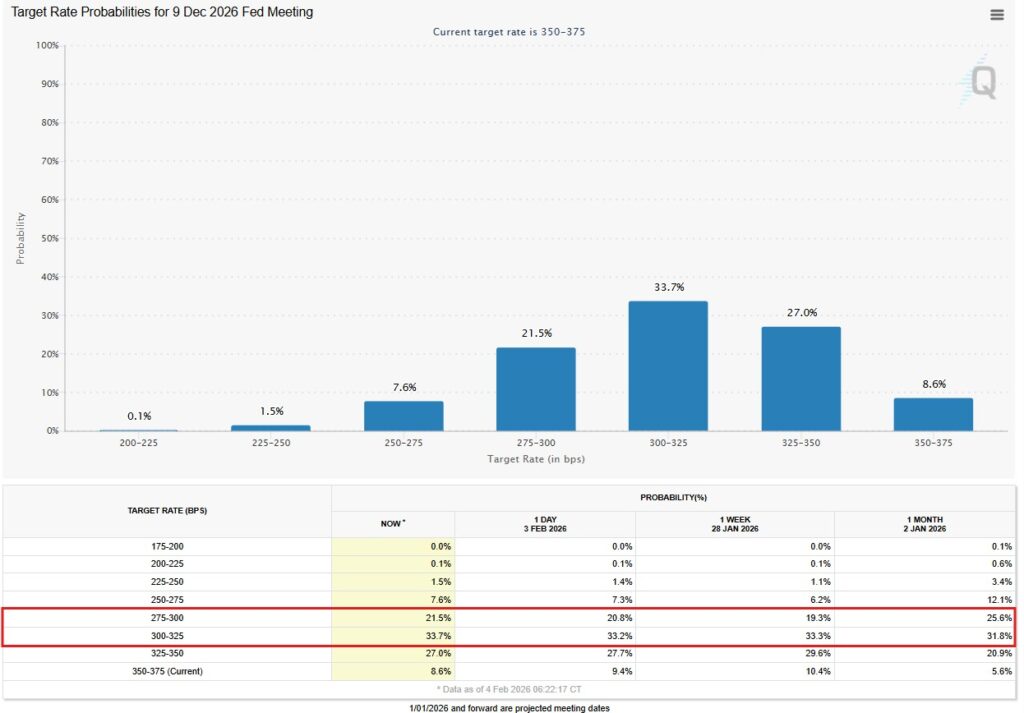
Source: CMEFedwatch
The recent volatility does not undermine gold’s core bullish foundations. Instead, it highlights a transition into a higher-beta phase of the cycle, where positioning and sentiment swings amplify price moves. With gold’s investment demand now structurally larger, corrections are likely to be sharper — but also more corrective than destructive.
Technical View
From a technical perspective, the recent pullback closely mirrors the April and October 2025 corrections, both marked by a clear MACD “death cross” and a sharp swing in net volume. In both cases, traders were forced to exit positions quickly to meet liquidity demands — a common dynamic when positioning becomes crowded.
Historically, gold does not rebound instantly after a sharp correction like this. In April 2025, gold required nearly four months to rebuild momentum and reclaim prior highs, while the October correction took closer to two months. This time, do expect a period of “digestion” where the price stabilizes before the next major move upward.
Source: Tradingview
Summary:
2025’s record demand re-priced gold’s role in global portfolios. With those fundamental drivers carrying into 2026, the outlook remains broadly bullish but more volatile, with consolidation acting as the bridge between near-term turbulence and the longer-term bull case.
Disclaimer: The material provided here has not been prepared in accordance with legal requirements designed to promote the independence of investment research and as such is considered to be a marketing communication. Whilst it is not subject to any prohibition on dealing ahead of the dissemination of investment research we will not seek to take any advantage before providing it to our client. No representation or warranty is given as to the accuracy or completeness of this information and therefore it shouldn’t be relied upon as such. Any research provided does not have regard to specific financial situations, needs or investment objectives. Vantage accepts no responsibility for any use that may be made of these comments and for any consequences that result. Consequently, any person acting on it does so entirely at their own risk. We advise any readers of this material to seek professional advice where necessary. Without the approval of Vantage, reproduction or redistribution of this information isn’t permitted.
-

Open Trading Account
Discover the endless trading possibilities with our cutting-edge platform, designed to empower our traders. Practice trading the markets with a free demo account today.
-

Download Vantage App
Trade on the go with the Vantage All-In-One Trading App, where smooth execution and market access come together in the palm of your hand.
-

Start Trading
Are you an existing user? Login to your account to start trading 1,000+ CFD products including forex, indices, gold, shares and more.
