
 Register
 Login
Login Register


FOMC Preview: A Done Deal with Markets Hungry for the Roadmap Ahead

Hebe Chen >
Senior Market Analyst
Hebe Chen >
Senior Market Analyst
 Updated Mon, 2025 June 16 08:26

The Federal Reserve heads into its June 17–18 policy meeting with the market largely convinced that interest rates will remain unchanged. But the real watch point lies beneath the surface—as investors await updates to the Fed’s economic projections and dot plot that could recalibrate expectations for rate cuts in the remaining of 2025.
What’s the expectation for this meeting?
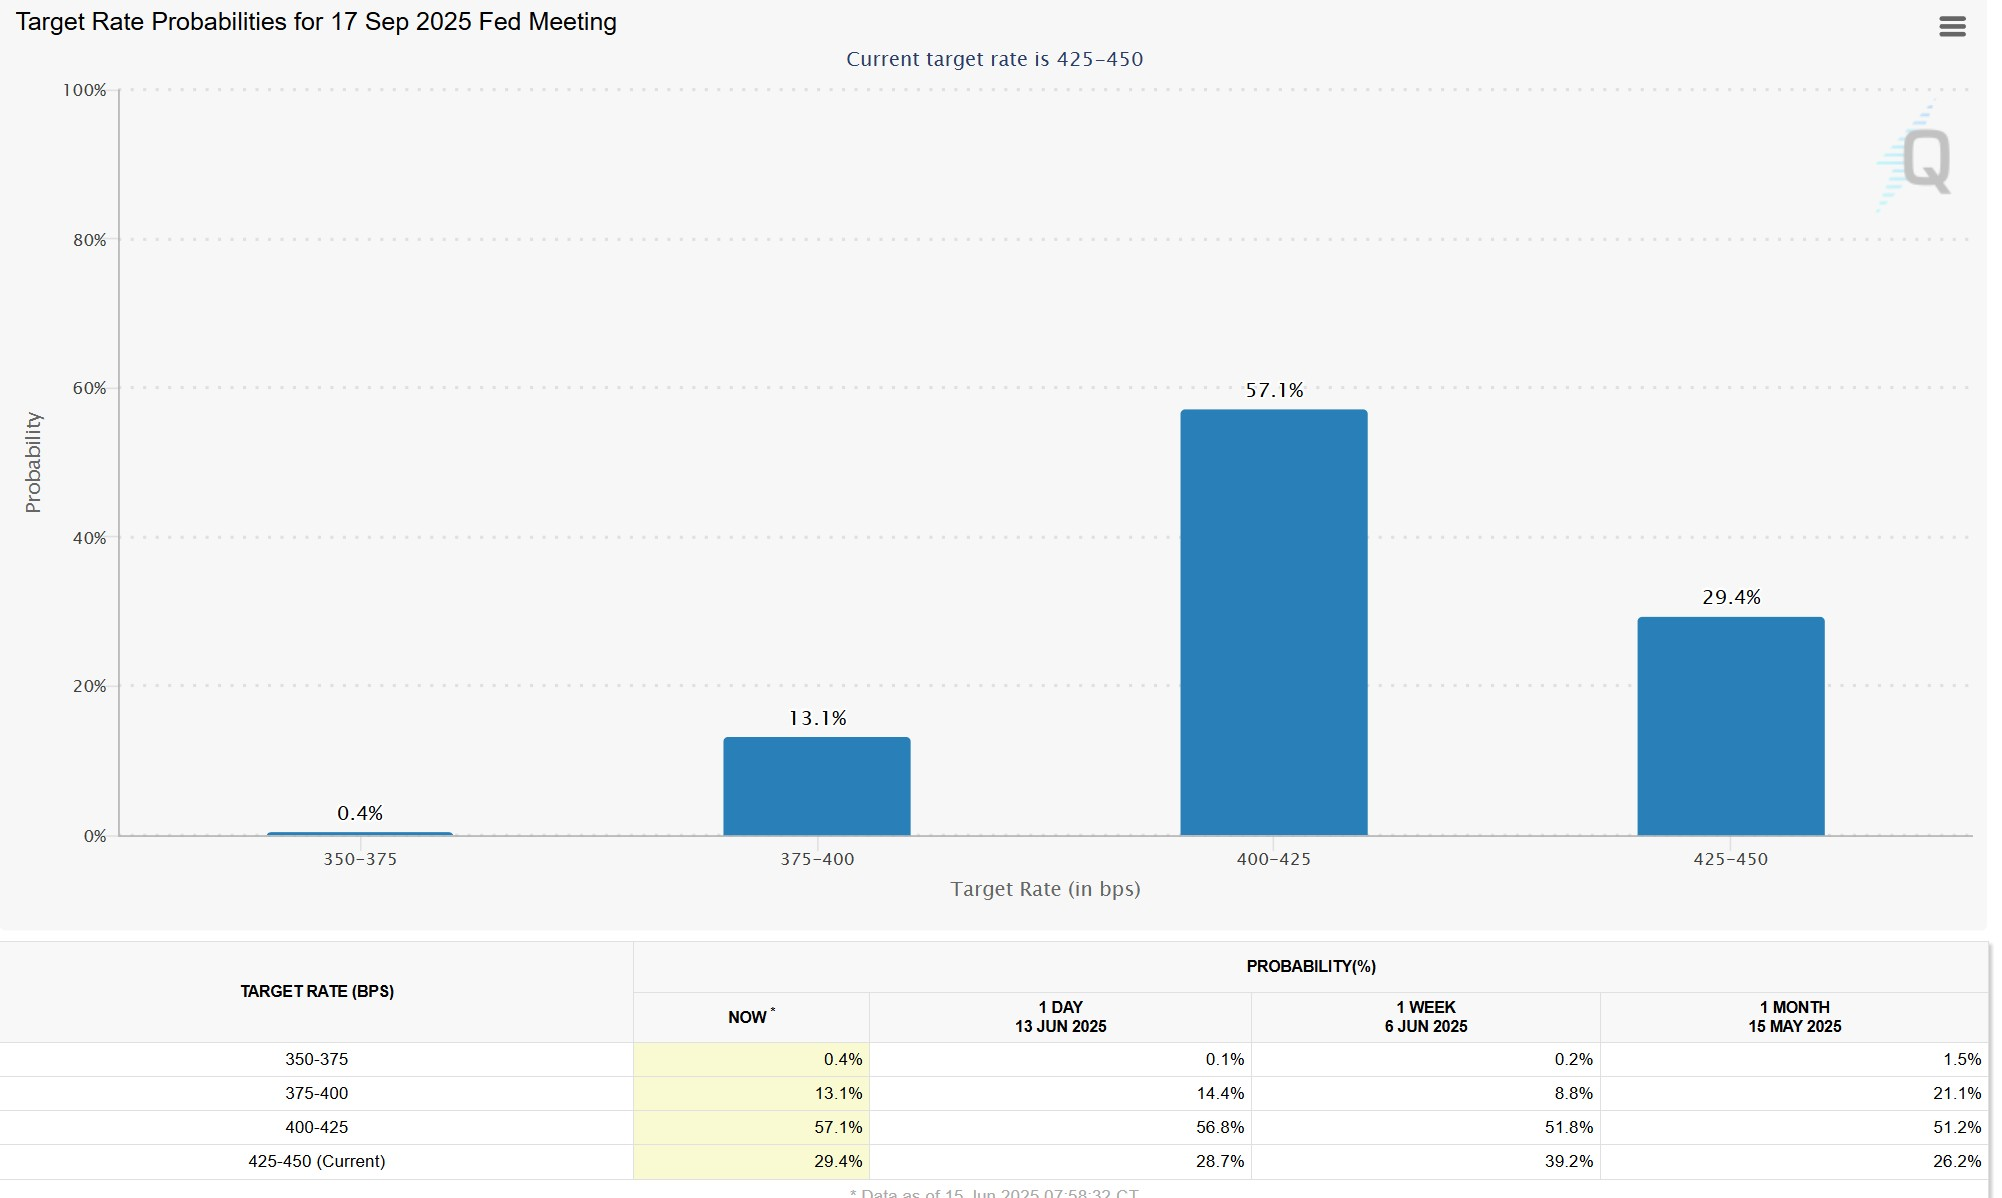
Markets are now pricing a 96% chance that the Fed will hold rates steady at 5.25–5.50%, according to CME FedWatch data—and consensus suggests the Fed is likely to stay on hold through the next two meetings. While recent inflation data has cooled, expectations for the next rate cut have pointed firmly to September, as shown in the FedWatch outlook below.
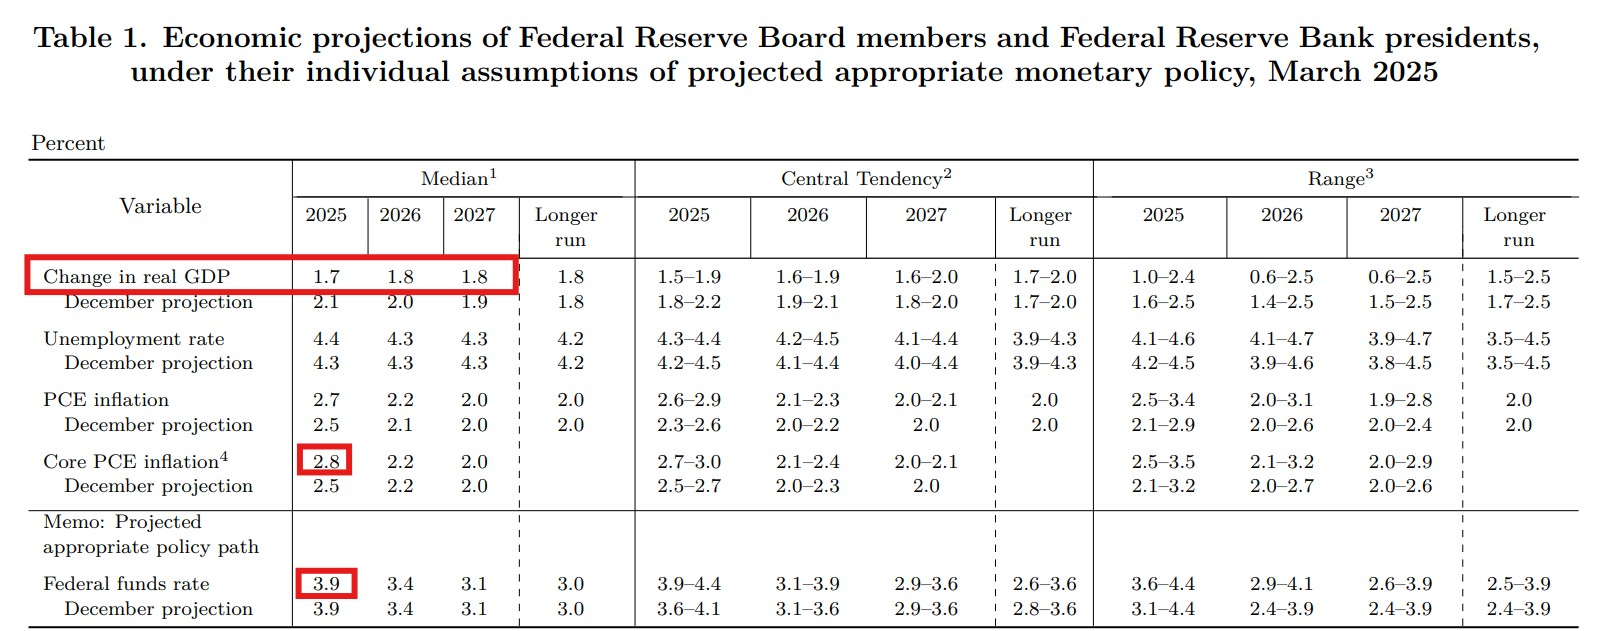
But a no-change decision doesn’t mean a no-impact meeting. The real market mover lies in the updated dot plot and inflation projections. In March, the Fed raised its 2025 core PCE inflation forecast to 2.8%, up from 2.5% in December—strengthening the argument for delaying cuts. Any hawkish shift in the distribution of dots could easily reprice rate expectations and shake up risk sentiment.
Dot Plot in Focus: How many cuts on the cards for this Year?
Back in March, the median projection still pointed to two to three cuts in 2025. But that guidance now appears under review as the inflation impact unleased by the Trump’s tariff agenda is yet to be clear. Given that, the Fed may trim that to two cuts—or even one—if inflation progress stalls and the risk of flare-up rising. The Fed funds rate was projected at 3.9% by year-end in March, any swift to this projection figure will be pivotal in reshaping the market’s expectation for the monetary path into Q3, and no surprising ripple into the fixed income, equity and commodity markets.
A dedicate balance between softening growth and inflation uncertainty
While inflation remains the Fed’s primary concern, the growth outlook is showing signs of strain. The U.S. economy contracted at an annualized rate of 0.2% in Q1 2025—the first quarterly decline in three years—driven largely by a surge in imports ahead of anticipated tariffs, which widened the trade deficit and weighed on GDP.
Even before this GDP print, the Fed had already lowered its 2025 real GDP growth forecast to 1.7% from 2.1% as projected in December. The unemployment rate was also projected to rise to 4.4%, suggesting a another sign of slower economy from the labor market .
Against this backdrop of economic uncertainty and persistent inflation pressures, Chair Powell faces a delicate balancing act. His post-meeting message will need to acknowledge the softening data without encouraging premature rate-cut expectations.
Ultimately, the June FOMC meeting isn’t about the rate decision itself, but more about the guidance ahead. A modest shift in the dot plot or nuances in Powell’s tone could prompt significant market reactions. For traders, the subtleties in the Fed’s communication will carry more weight than the decision to hold rates steady.
US Dollar Technical Analysis
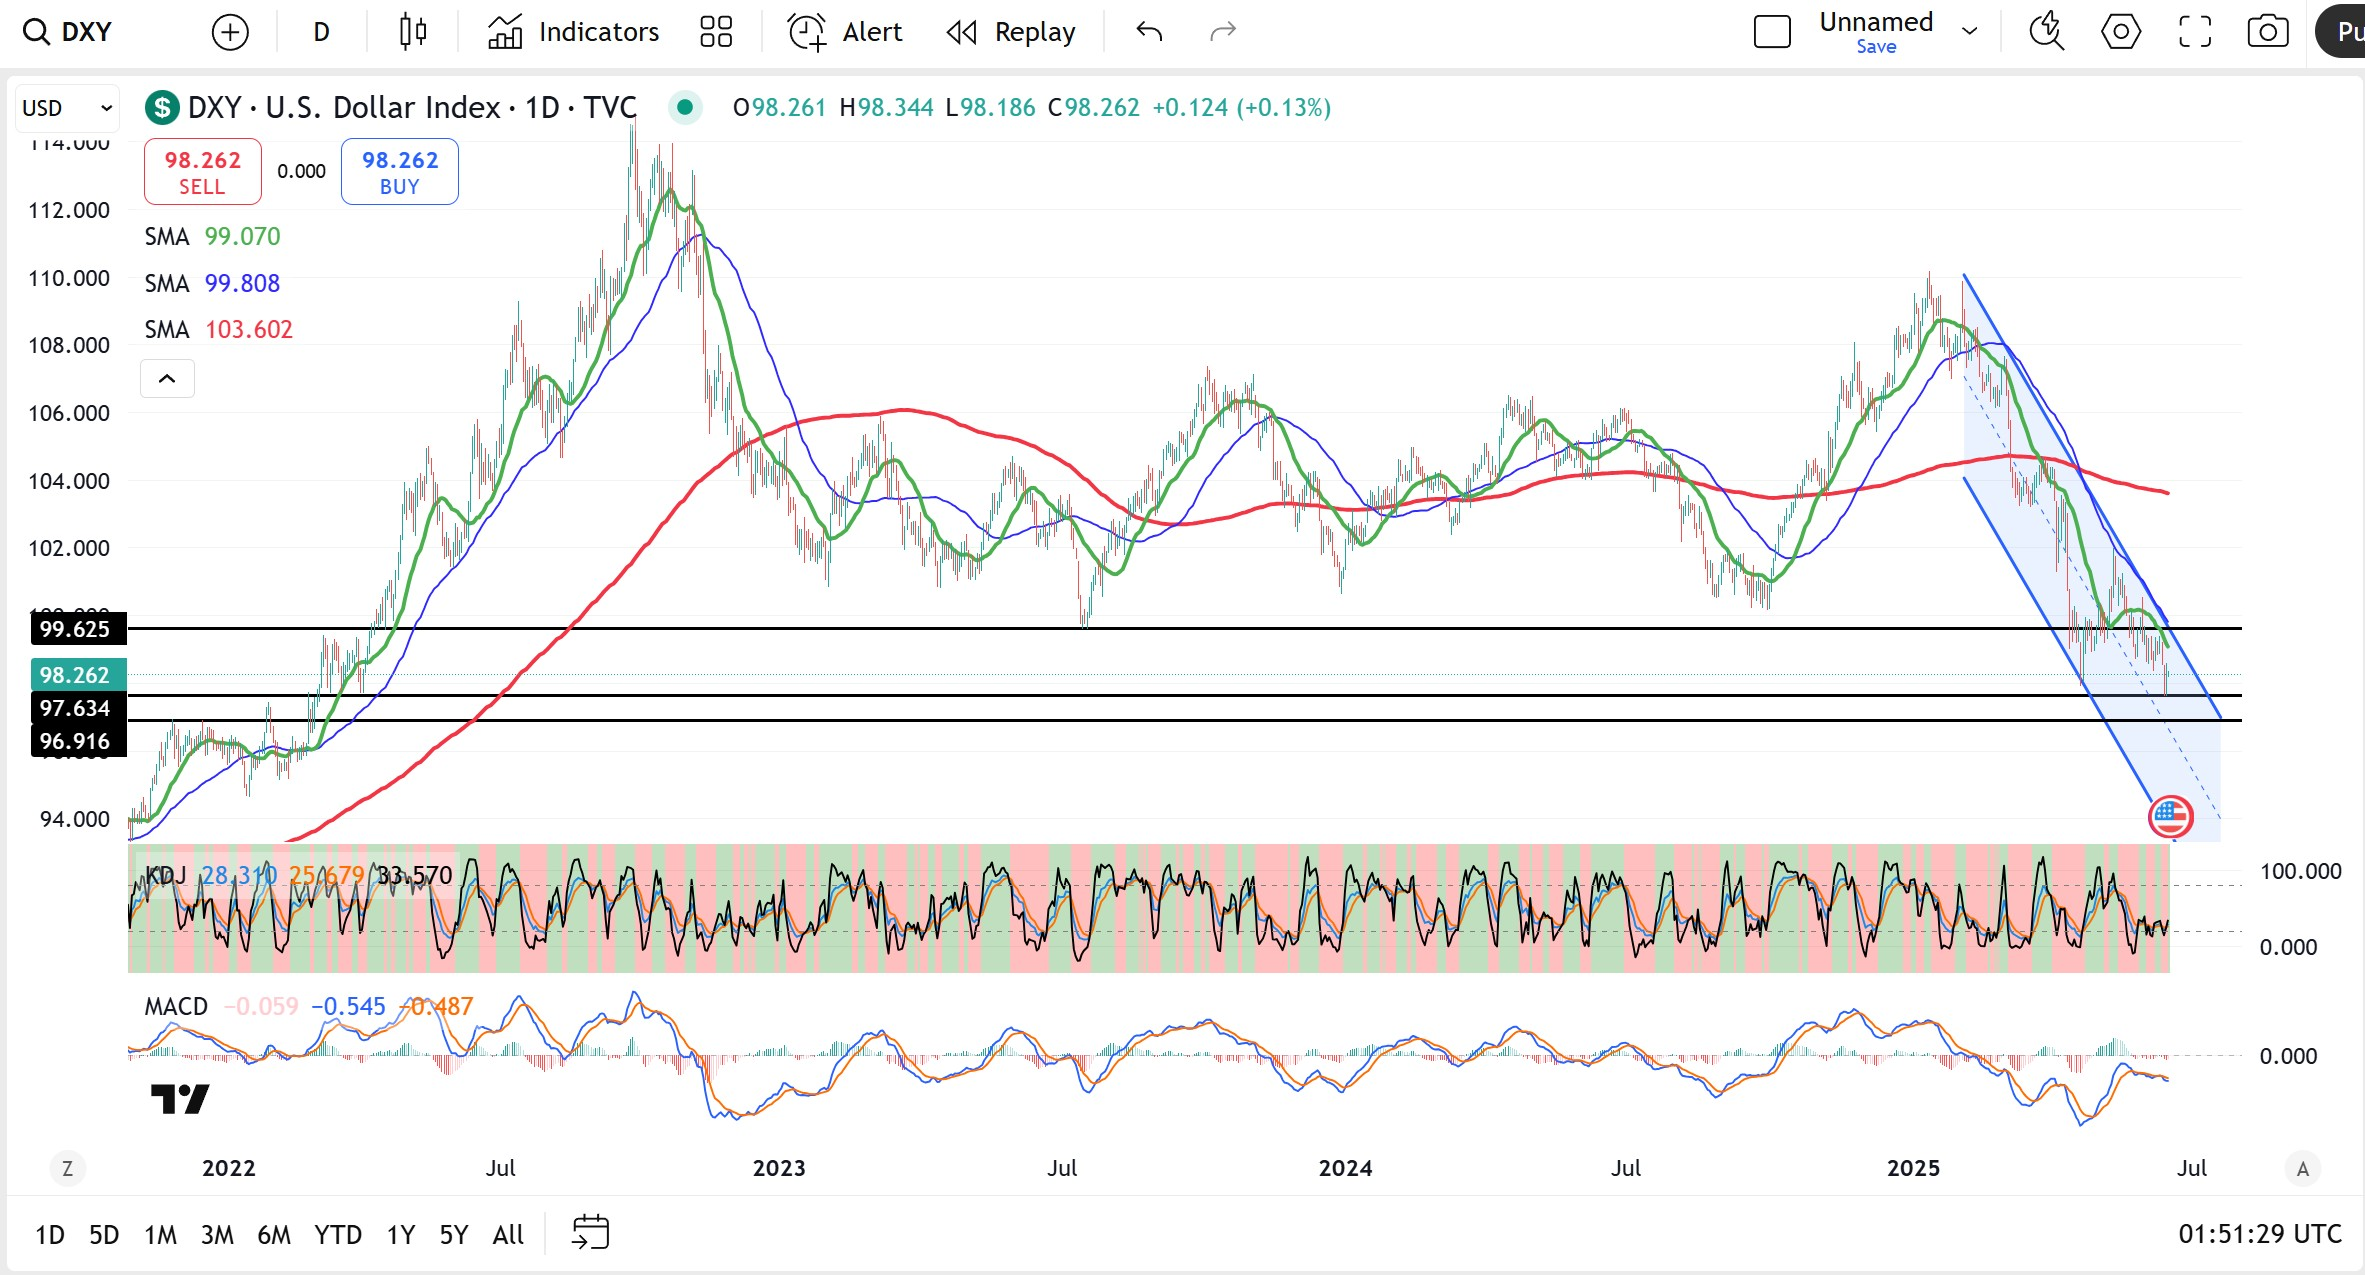
According to the daily chart, the U.S. Dollar Index (DXY) remains trapped in a clear downward channel, with no sign of reversal yet in sight. Despite being supported by the haven demand, last Friday’s close at 98.26 didn’t help the price to overcome the key resistance near 98.6o—the former support that has now flipped into a ceiling. Moreover, all three key SMAs (50/100/200) are above the current price and sloping downward, reinforcing the dominant bearish trend.
Momentum indicators paint a heavy picture: the MACD remains bearish, and the KDJ continues to hover near oversold territory without a clean bullish crossover.
As the Fed meeting approaches, any dovish tilt could push the dollar toward the next major support zones at 97.63 and 96.91. The downtrend remains intact unless DXY can break above 99.63 with conviction. Until then, rallies are likely to be sold into, and the broader setup still favours USD weakness, especially if rate cut pricing firms further.
Disclaimer: The material provided here has not been prepared in accordance with legal requirements designed to promote the independence of investment research and as such is considered to be a marketing communication. Whilst it is not subject to any prohibition on dealing ahead of the dissemination of investment research we will not seek to take any advantage before providing it to our client. No representation or warranty is given as to the accuracy or completeness of this information and therefore it shouldn’t be relied upon as such. Any research provided does not have regard to specific financial situations, needs or investment objectives. Vantage accepts no responsibility for any use that may be made of these comments and for any consequences that result. Consequently, any person acting on it does so entirely at their own risk. We advise any readers of this material to seek professional advice where necessary. Without the approval of Vantage, reproduction or redistribution of this information isn’t permitted.
-

Open Trading Account
Discover the endless trading possibilities with our cutting-edge platform, designed to empower our traders. Practice trading the markets with a free demo account today.
-

Download Vantage App
Trade on the go with the Vantage All-In-One Trading App, where smooth execution and market access come together in the palm of your hand.
-

Start Trading
Are you an existing user? Login to your account to start trading 1,000+ CFD products including forex, indices, gold, shares and more.
