
 Register
 Login
Login Register


DJ30, NAS100, SP500: Caution Takes Centre Stage in US Equities

Vantage Editorial Team >
Market Analyst
Vantage Editorial Team >
Market Analyst
 Updated Tue, 2025 August 5 04:51

US equities had been in a strong uptrend, but recent economic data have sparked renewed caution. US NonFarm Payrolls (NFP) released last Friday missed estimates by a wide margin, showing just a 73k gain versus the expected 110k. This weak print casts doubt on the strength of the US labour market, which was previously seen as solid, even under restrictive monetary policy and a cautious Fed.
On the upside, the Q2 earnings season has shown that American companies continue to perform well. Most firms beat their Q2 estimates, even as valuations remain elevated. However, the outlook ahead is clouded by trade headlines and tariff-related developments that are adding to market volatility.
DJ30 – The Defensive Play is Back
The Dow Jones Industrial Average is seeing renewed interest as investors rotate into value and defensive sectors amidst uncertain times. Strong bank earnings, supported by robust net interest income and resilient credit conditions, have helped lift sentiment. Nevertheless, Friday’s disappointing US NFP report weighed on the index. Still, the broader rotation into defensive sectors continues as a wider theme in equity markets, which could cushion DJ30’s downside risks in the near term.
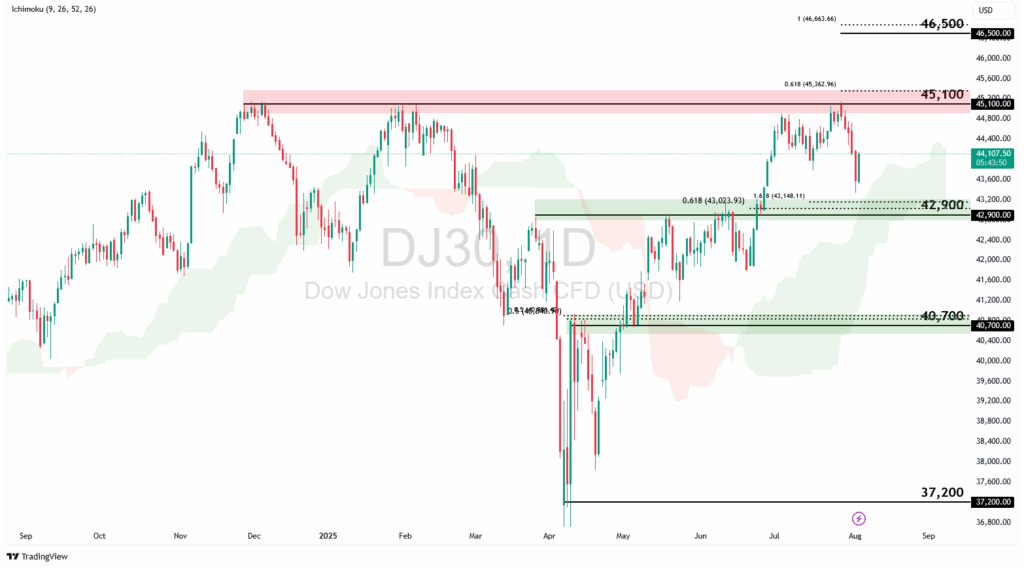
DJ30 retreated from recent highs and is hovering near the $42,900 level after last week’s NFP release. However, the index continues to trade above the Ichimoku cloud, indicating the bullish momentum is still holding. If the price holds above the $42,900 level, we could see a continuation of the upside move towards the $45,100 resistance, in line with the 61.8% Fibonacci Extension level. A break above this swing high resistance could see the price move higher towards the $46,500 level, in line with the 100% Fibonacci Extension level.
However, a deeper retracement could shift market sentiment. If the price breaks below the $42,900 level, we could see a potential retest of the $40,700 support level, in line with the 50% Fibonacci Retracement and Extension levels.
NAS100 – Tech Continues to Lead, But Caution is Creeping In
NASDAQ is still showing strength despite the recent price retracement. The index’s performance has mostly been driven by heavyweight tech stocks, such as Nvidia and Microsoft, that have benefited from strong earnings and growing optimism around AI. However, rising volatility, as seen by the VIX index ticking higher since the end of July, suggests fear is brewing.
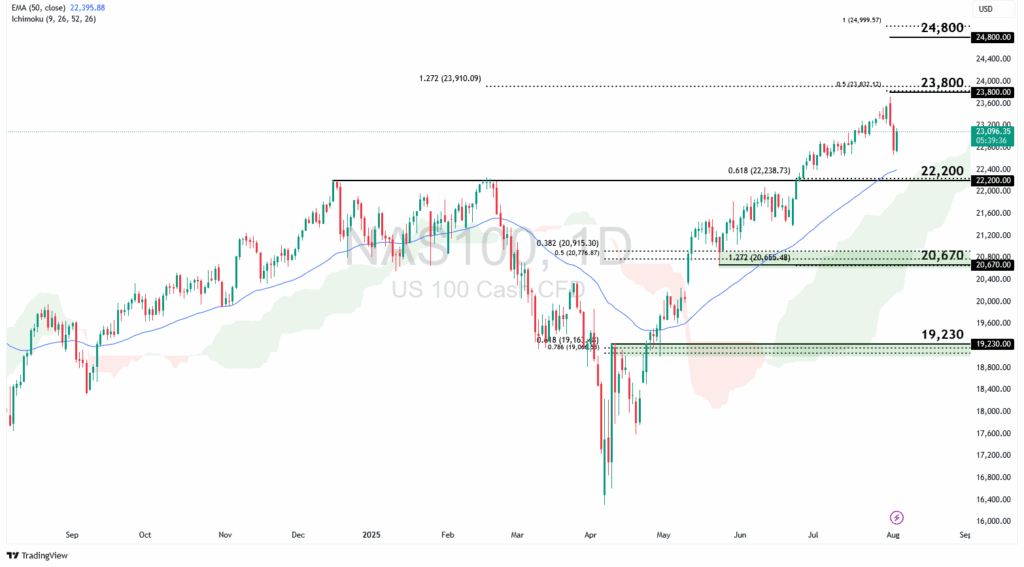
NAS100 is still hovering above both the Ichimoku cloud and 50-EMA even after the sharp decline late last week. A deeper retracement could prompt a retest of the $22,200 support level, which is in line with the 61.8% Fibonacci Retracement and 50-EMA. A bounce here could reignite bullish momentum, with resistance levels at $23,800 and $24,800 next in focus.
However, a break below the $22,200 support could mean a steeper decline toward following support levels, such as the $20,670 support level, which is in line with an area of strong Fibonacci confluence, or even the $19,230 pullback support, which is in line with the 61.8% Fibonacci Retracement and the 78.6% Fibonacci Extension levels. This could suggest that bullish fervour has faded and tech stocks are undergoing a broader revaluation by the market.
SP500 – The Market’s Barometer to be Watched Closely
The SP500 is widely seen as the benchmark for the US stock market, offering a broad look at overall equity health. However, concentration risk remains a key concern. The top seven stocks still account for more than 30% of the index’s weight.

SP500 is approaching the $6,130 support level, in line with the 61.8% Fibonacci Retracement level and 50-EMA. A bounce from this level could drive the index higher toward the $6,500 resistance, near the 127.2% Fibonacci Retracement and 61.8% Fibonacci Extension.
However, a deeper throwback and break below the $6,130 support could see the price move lower towards the $5,785 support level, in line with the 127.2% Fibonacci Retracement and 50% Fibonacci Extension levels. A test of this level would place the price below key technical indicators, potentially signalling a shift in market sentiment.
All eyes are now on the Fed. The recent softening in the US labour market has strengthened expectations for a rate cut in September. Looking ahead, keep an eye on upcoming Fed remarks for signs of a shift toward easing monetary policy. Any dovish tilts could be a boon to equity markets as traders increasingly expect rate cuts to support economic momentum.
Disclaimer: The material provided here has not been prepared in accordance with legal requirements designed to promote the independence of investment research and as such is considered to be a marketing communication. Whilst it is not subject to any prohibition on dealing ahead of the dissemination of investment research we will not seek to take any advantage before providing it to our client. No representation or warranty is given as to the accuracy or completeness of this information and therefore it shouldn’t be relied upon as such. Any research provided does not have regard to specific financial situations, needs or investment objectives. Vantage accepts no responsibility for any use that may be made of these comments and for any consequences that result. Consequently, any person acting on it does so entirely at their own risk. We advise any readers of this material to seek professional advice where necessary. Without the approval of Vantage, reproduction or redistribution of this information isn’t permitted.
-

Open Trading Account
Discover the endless trading possibilities with our cutting-edge platform, designed to empower our traders. Practice trading the markets with a free demo account today.
-

Download Vantage App
Trade on the go with the Vantage All-In-One Trading App, where smooth execution and market access come together in the palm of your hand.
-

Start Trading
Are you an existing user? Login to your account to start trading 1,000+ CFD products including forex, indices, gold, shares and more.
