
 Register
 Login
Login Register


Australia’s Hot CPI Puts Rate Hike Back in Play; Wall Street Rebounds on Fed-Cut Hopes

Hebe Chen >
Senior Market Analyst
Hebe Chen >
Senior Market Analyst
 Updated Wed, 2025 November 26 06:35

Australia’s October CPI rose 1.3% QoQ and 3.8% YoY — a hotter-than-expected print that pulls rate hikes back into the conversation. The result highlights the RBA’s lingering concern over sticky services and housing inflation, leaving the policy path finely balanced heading into year-end. For markets, this raises the prospect of a more cautious RBA and a choppier near-term outlook for the AUD and local equities.
In the US, sentiment improved after a batch of delayed data releases painted a softer macro picture. Retail sales rose just 0.2% in September — well below forecasts — while producer prices ticked up modestly to 2.7% YoY. Together, they reinforced expectations for a Fed cut when policymakers meet next month. That helped lift US equities, though tech weakness kept the Nasdaq’s gains in check, while healthcare strength supported the Dow.
WTI crude slipped to a five-week low near $58 a barrel after reports suggested Ukraine and Russia had agreed to revised peace terms. For gold, the backdrop remains mixed: one geopolitical pressure point is easing even as Asia-Pacific tensions rise. Coupled with softer US data and shifting Fed expectations, safe-haven demand remains resilient.
This week we take a closer look at Gold, AUD/USD, and Bitcoin.
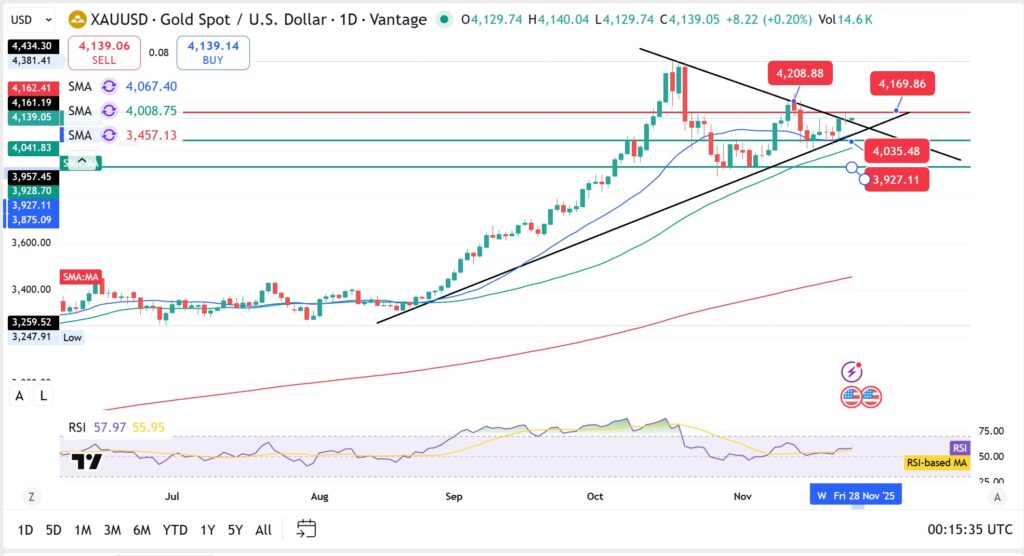
Gold: Steadying Above Support as the Market Catches Its Breath
Gold is stabilising after its recent pullback. For six consecutive sessions, prices have held above the $4,035 support zone, signalling that the sharp liquidation phase has eased. Buyers are gradually returning, and the tight consolidation between $4,035 and $4,169 suggests medium-term holders remain confident.
This structure echoes earlier phases of the 2024–25 gold rally — a breakout, a meaningful correction, a multi-day pause, and then a resumption higher.
- Resistance: $4,165–$4,210
- Support: $4,035 and $3,930
- Set-up: Trendlines still point south but the underlying bull trend remains intact
A clean break above $4,170 would open the door for a retest of the $4,208 peak.
AUD/USD: Will the CPI Surprise Help to Break the Downtrend?
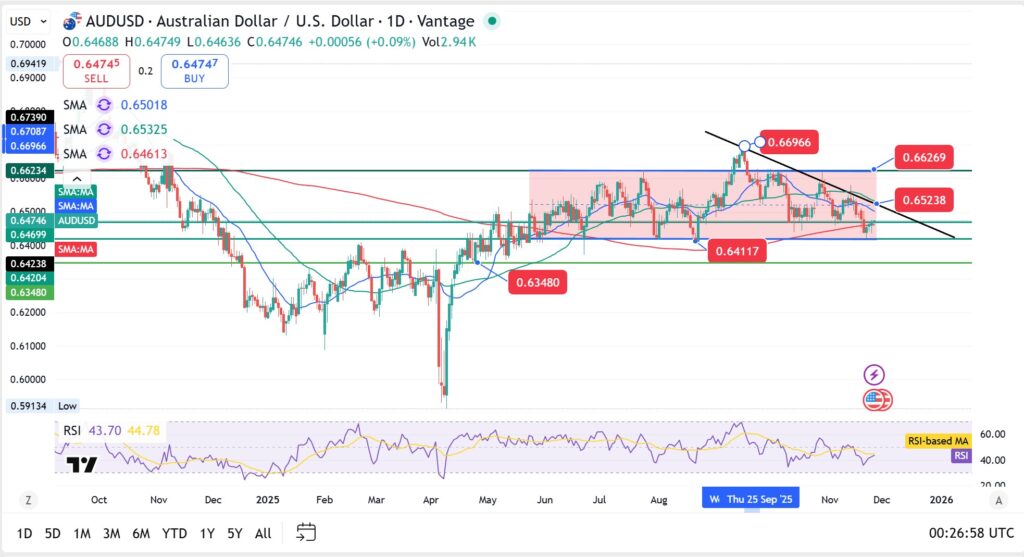
AUD/USD remains locked in its broad multi-month consolidation band but continues to struggle beneath the clear descending trendline from the October high. The pair slipped back under 0.65 before the CPI release, reflecting how global dynamics — especially US inflation expectations — have dominated price action.
Whether today’s hotter CPI print can challenge that downtrend is the key near-term focus.
- Current range: 0.6410–0.6523
- Key pivot: 200-day SMA near 0.6460
- Momentum: RSI near 40, still favouring sellers
- Upside markers: 0.6520 → 0.6625
- Bias: Rallies remain capped unless AU CPI moves the market meaningfully
The pair needs a sustained move above 0.6520 to shift sentiment, but the broader pattern still points to a cautious market leaning against strength.
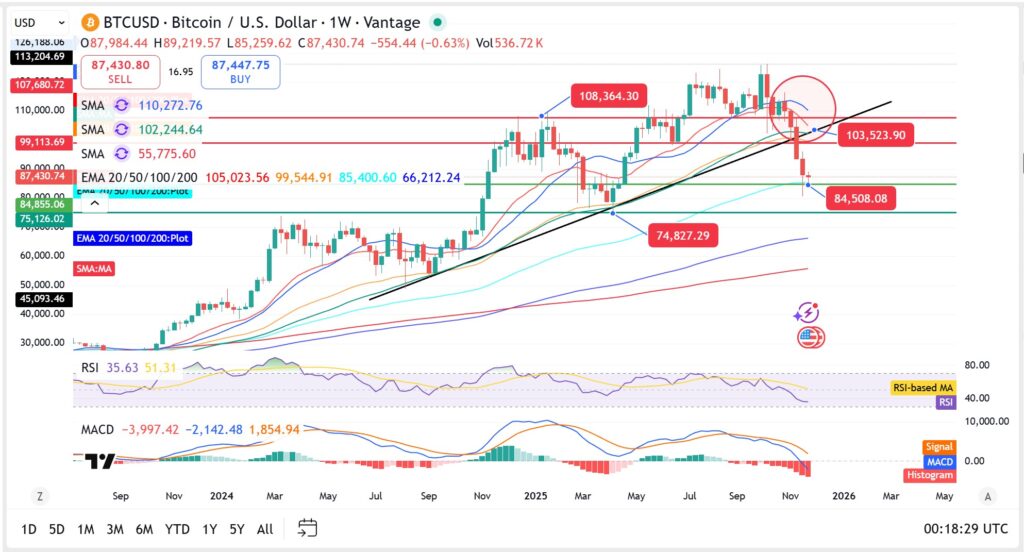
BTCUSD: Still Under Pressure as the Correction Deepens
Bitcoin’s pullback has now extended to roughly 30% from its 2025 peak, taking the price below US$90,000 and into territory last seen in early 2025. The weekly chart shows a clean break below long-term trendline support dating back to mid-2024, alongside decisive drops beneath the 20- and 50-week EMAs — a clear signal that the momentum structure has shifted.
- Weekly RSI: ~35 — not yet showing a durable bottom
- MACD: Deeply negative, reinforcing ongoing downside momentum
- Support: $84,500 first, then $75,800
- Key resistance: $103,500 — neckline of the broader topping pattern
- Bias: Downtrend remains intact unless BTC reclaims the neckline
The current set-up points to further volatility, with the medium-term trend still favouring lower levels unless a stronger macro catalyst emerges.
Disclaimer: The material provided here has not been prepared in accordance with legal requirements designed to promote the independence of investment research and as such is considered to be a marketing communication. Whilst it is not subject to any prohibition on dealing ahead of the dissemination of investment research we will not seek to take any advantage before providing it to our client. No representation or warranty is given as to the accuracy or completeness of this information and therefore it shouldn’t be relied upon as such. Any research provided does not have regard to specific financial situations, needs or investment objectives. Vantage accepts no responsibility for any use that may be made of these comments and for any consequences that result. Consequently, any person acting on it does so entirely at their own risk. We advise any readers of this material to seek professional advice where necessary. Without the approval of Vantage, reproduction or redistribution of this information isn’t permitted.
-

Open Trading Account
Discover the endless trading possibilities with our cutting-edge platform, designed to empower our traders. Practice trading the markets with a free demo account today.
-

Download Vantage App
Trade on the go with the Vantage All-In-One Trading App, where smooth execution and market access come together in the palm of your hand.
-

Start Trading
Are you an existing user? Login to your account to start trading 1,000+ CFD products including forex, indices, gold, shares and more.
