
 Register
 Login
Login Register


Australia’s Earnings Season Spotlight: CBA, CSL and Evolution Mining

Hebe Chen >
Senior Market Analyst
Hebe Chen >
Senior Market Analyst
 Updated Tue, 2026 February 10 12:11

This week marks a pivotal moment for the ASX as three heavyweights — Commonwealth Bank of Australia, CSL Limited and Evolution Mining — prepare to report earnings, each facing a very different market test.
Commonwealth Bank
Earnings Date: February 11th, 2026
CBA enters reporting season after a near-10% rebound in just two weeks, immediately lifting expectations. History also matters: the stock has sold off after the past two earnings results, regardless of whether the numbers beat or missed, signalling investors are demanding more than simply “solid” delivery.
Fundamentally, net interest margins, profitability and dividends remain the core pillars. With the RBA re-entering a tightening phase, this result is less about headline profit and more about whether CBA can strategically catch on the new higher-for-longer rate cycle. A credible first-half update showing margin resilience and stable credit quality would go a long way toward restoring confidence.
Technically, CBA peaked last June and remains in a corrective phase. A well-defined head-and-shoulders pattern leaves the mid-160s as a clear ceiling. Momentum indicators are improving from depressed levels — MACD is turning higher and RSI is recovering — suggesting near-term relief rather than a confirmed trend reversal.

CSL: CSL Limited
Earnings Date: February 11th, 2026
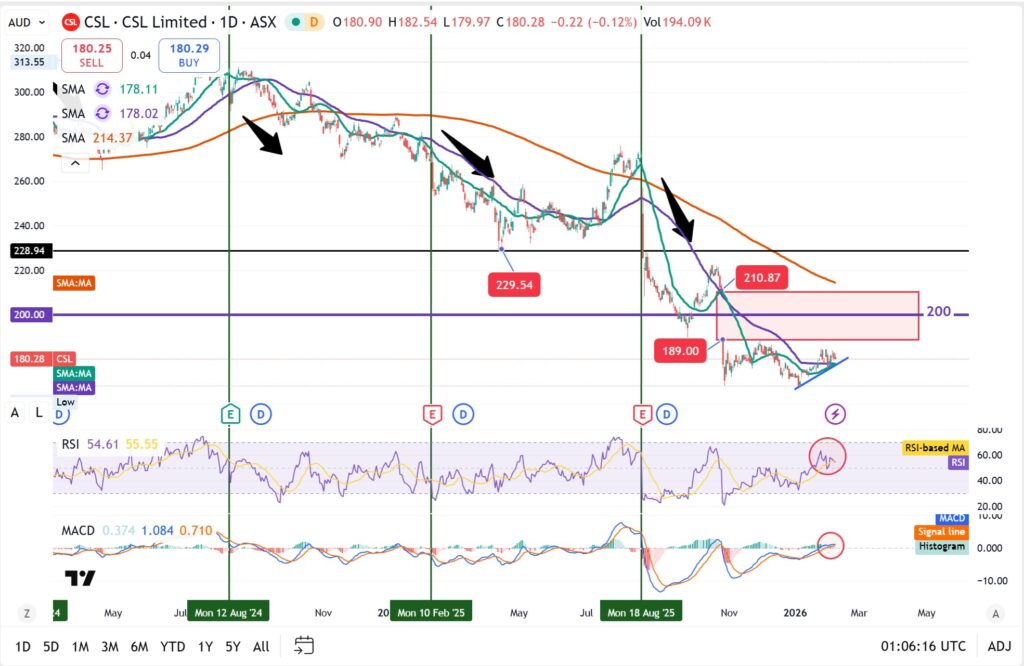
CSL is currently trading near its lowest level since 2019 after multiple rounds of earnings disappointment since 2024. Revenue growth remains intact, but margins and execution have failed to consistently exceed expectations, while restructuring uncertainty continues to weigh on sentiment.
The chart reflects that pressure clearly. CSL has been locked in a persistent downtrend since its 2024 peak, with rallies repeatedly capped by the falling long-term moving average. The August sell-off broke key support near 230, turning it into a major resistance level. Since January, the stock has attempted to stabilise, but now faces a dense resistance band between 189 and 210, with the psychological 200 level sitting squarely in the middle.
Momentum indicators show early signs of improvement — RSI is at its highest since October and MACD is flattening — but there is still no confirmed reversal. This earnings season is about proving the earnings bleed has stopped, not delivering a blockbuster beat.
Evolution Mining (EVN)
Earnings date: February 11, 2026
Evolution Mining stands out as a momentum leader. The fundamental backdrop is strong, with second-quarter operating cash flow up 57% and gold production reaching 191,000 ounces. Elevated gold prices, improving margins and a strengthening balance sheet have sharply reduced earnings risk.
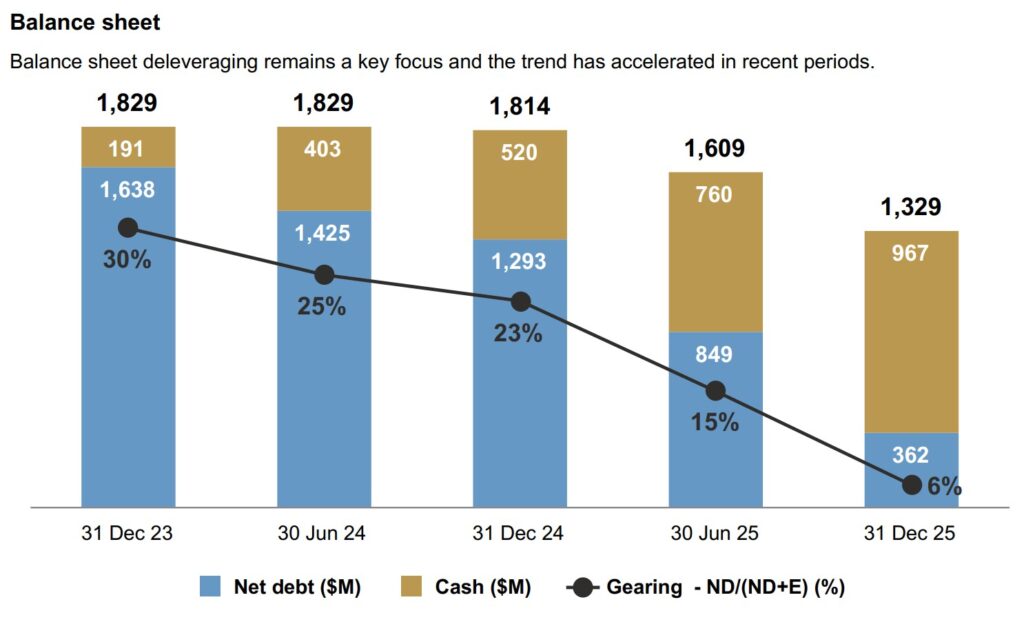
Source: Evolution Mining
That strength is reflected in price action, following a stellar 170% gain last year. EVN remains in a clean ascending trend, closely tracking the gold price. Recent pullbacks have been orderly, with the stock holding above its 20- and 50-day moving averages — a classic sign of trend integrity. If weakness extends, the 13.9–14.0 zone stands out as key support, marking former resistance now turned support.
The main near-term caution lies in momentum. A recent MACD crossover resembles patterns seen during previous gold pullbacks, suggesting consolidation may continue before the next leg higher. Even so, earnings risk appears contained, with gold volatility more likely to drive short-term price swings than fundamentals.

Disclaimer: The material provided here has not been prepared in accordance with legal requirements designed to promote the independence of investment research and as such is considered to be a marketing communication. Whilst it is not subject to any prohibition on dealing ahead of the dissemination of investment research we will not seek to take any advantage before providing it to our client. No representation or warranty is given as to the accuracy or completeness of this information and therefore it shouldn’t be relied upon as such. Any research provided does not have regard to specific financial situations, needs or investment objectives. Vantage accepts no responsibility for any use that may be made of these comments and for any consequences that result. Consequently, any person acting on it does so entirely at their own risk. We advise any readers of this material to seek professional advice where necessary. Without the approval of Vantage, reproduction or redistribution of this information isn’t permitted.
-

Open Trading Account
Discover the endless trading possibilities with our cutting-edge platform, designed to empower our traders. Practice trading the markets with a free demo account today.
-

Download Vantage App
Trade on the go with the Vantage All-In-One Trading App, where smooth execution and market access come together in the palm of your hand.
-

Start Trading
Are you an existing user? Login to your account to start trading 1,000+ CFD products including forex, indices, gold, shares and more.
