
 Register
 Login
Login Register


Australian Equities Could Be Tired

Jamie Dutta >
Market Analyst
Jamie Dutta >
Market Analyst
 Updated Thu, 2024 August 22 10:02

- Stock markets are likely to continue in the same overall direction from country to country.
- Aussie stocks seems overdone, or at least tired.
- Stagnation seems widespread, and in various sectors.
The ASX 200 continues to see a lot of overhead noise, as the equity markets in general do around the world. Ultimately, we are seeing many traders out there treat the markets in a way that the correlation between markets is getting closer and tighter. In other words, it is a situation whereas one market goes, it will often influence how other markets behave in unexpected ways.
ASX 200
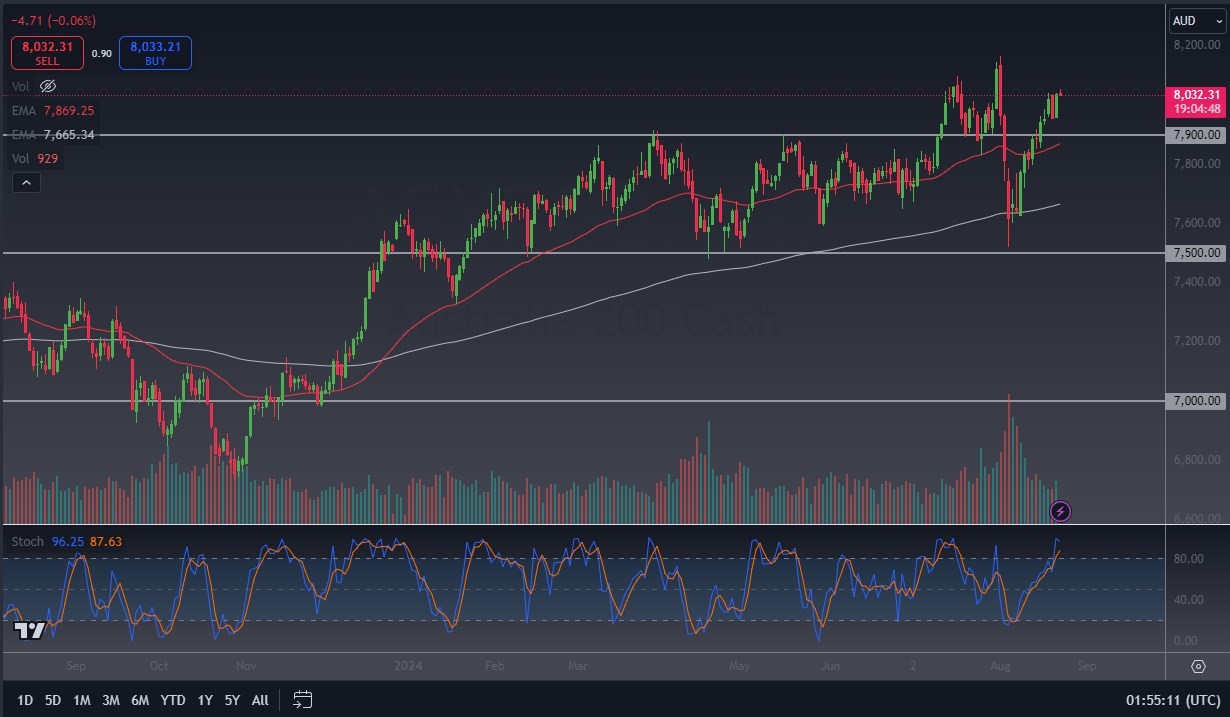
The ASX 200 has been bullish for a couple of weeks, as the market reached the 8035 level in late trading on Wednesday. This is a market that has been here before, but at the end of the day, the area continues to see resistance just above. In this prism, a lot of people will look at the area as one where a certain amount of profit collection is possible.
Furthermore, the technical analysis also gives a few hints. While the 50 Day EMA is sitting just below the 7900 level and rising, this could end up being a potential support level. The Stochastic Oscillator is now in the overbought region, and now looks as if a crossover could be coming soon. In this environment, it is possible that the market sees pressures.
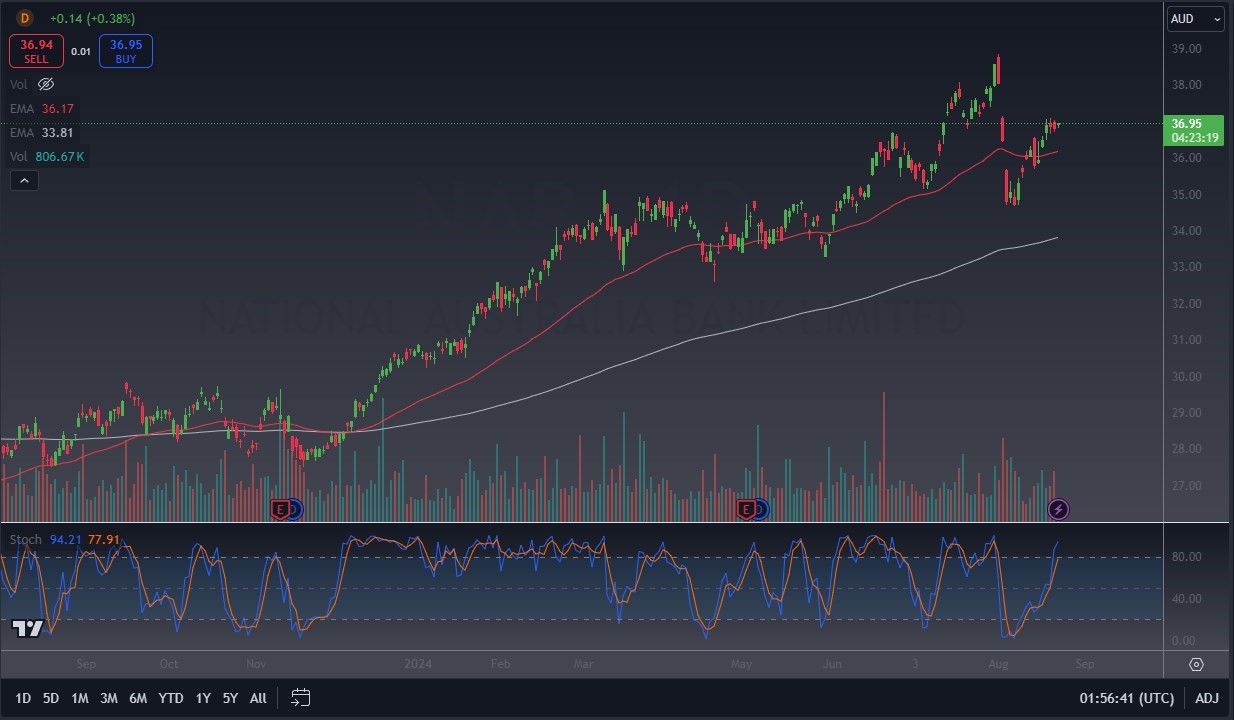
NAB (National Australia Bank)
The situation on the NAB chart suggests that we could be seeing a bit of an overstretched condition here as well, as the Stochastic Oscillator is overbought, and looks ready to see a crossover as well. It is also worth noting that there is a bit of a gap just above that has yet to be filled. Traders could look at this as a resistance barrier as well.
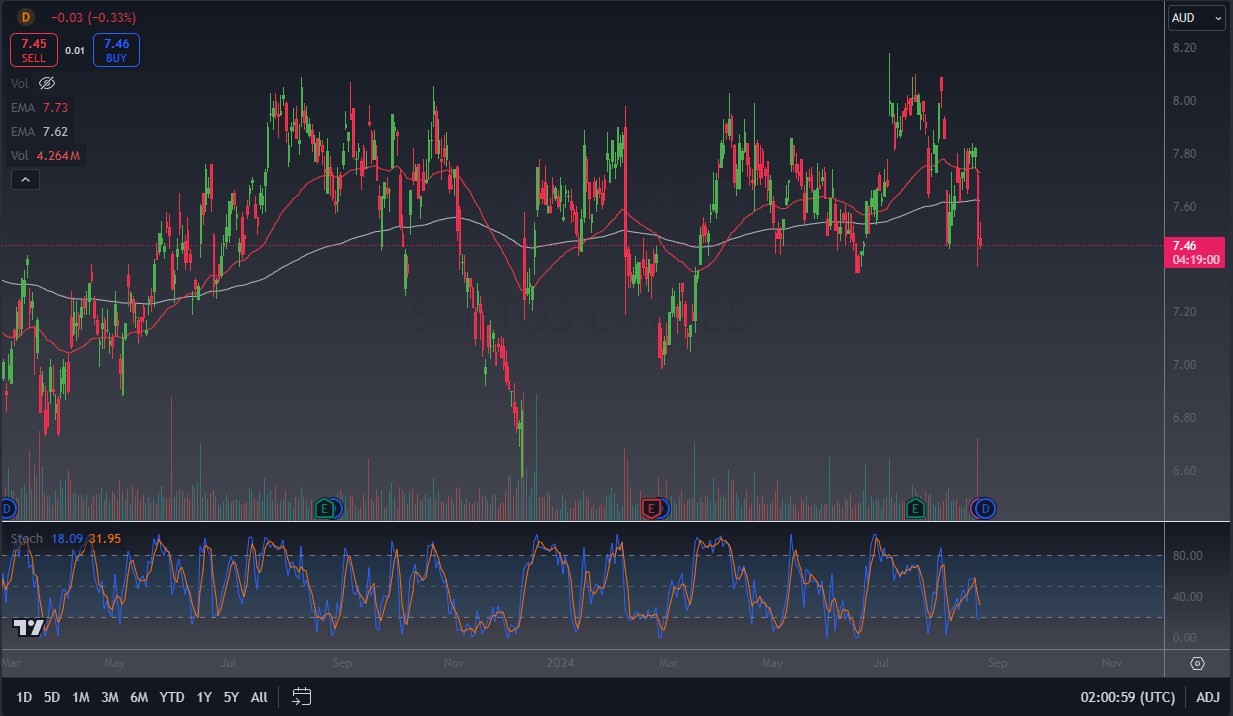
Santos Ltd (STO)
The energy company Santos has found itself struggling as of late, although it is more of a sideways market. Over the last few sessions, STO has pulled back from the AU$8 area but seems to see a certain amount of support near the AU$7 region. With this, it is simply a chart that looks tired and rangebound.
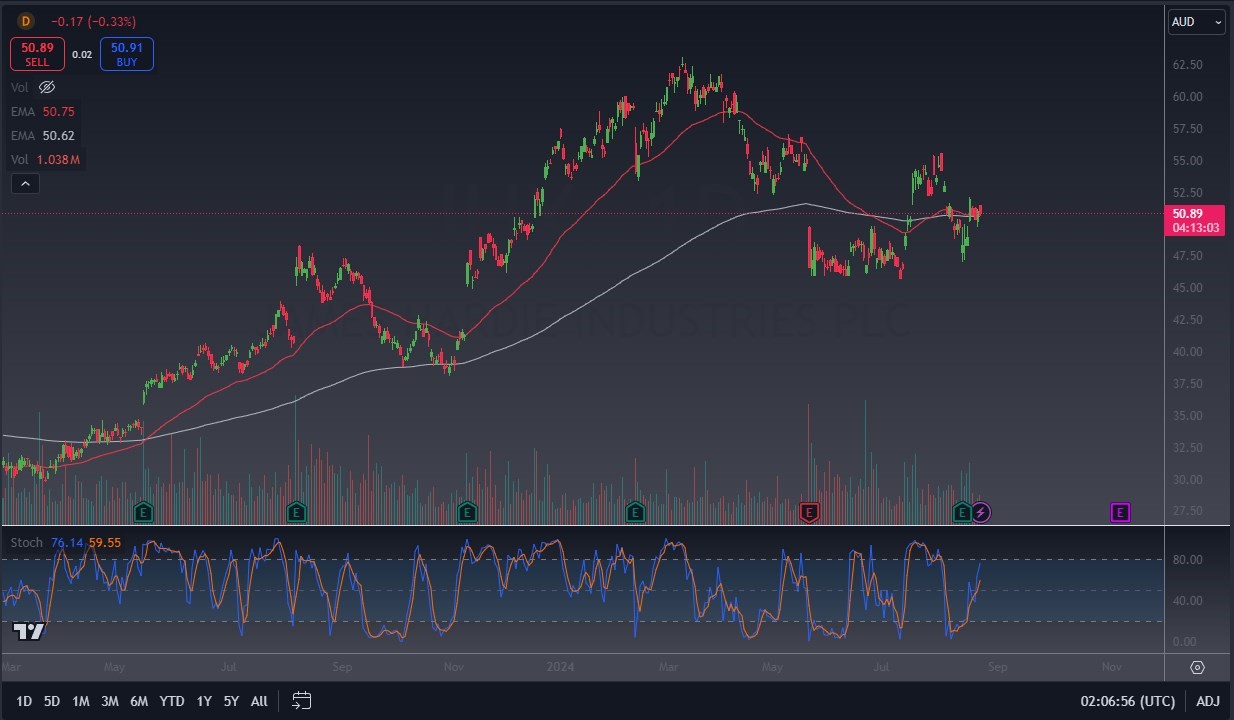
James Hardie Industries (JHX)
James Hardie Industries, the materials giant in Australia, has seen a lot of sideways action when looked at through the prism of the last several weeks. The major moving averages, being the 50 Day EMA and the 200 Day EMA, are flat, and this shows that the momentum could be gone in this market. It is also worth noting that the commodities markets are currently trying to price in the idea of a global economy might be slowing.
S&P 500
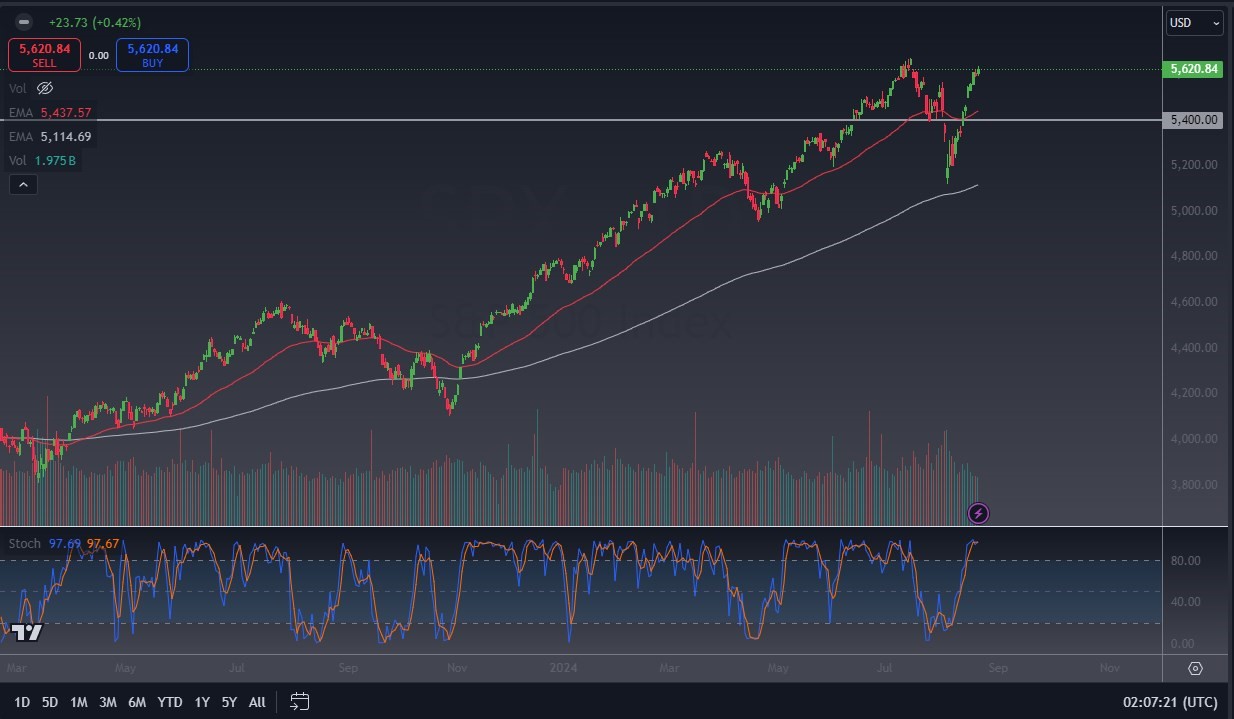
Looking across the Pacific, the S&P 500 had a 42 basis point gain overnight, but at the same time, it looks as though the buyers are starting to run out of steam. Remember, traders have been trading in all markets in the same general direction, and it looks like New York is starting to consider the move a bit overdone. The Stochastic Oscillator is extremely overbought and has formed a crossover. This could lead to some technical selling, which in turn could continue to keep Australia a bit soft as well.
Disclaimer: The material provided here has not been prepared in accordance with legal requirements designed to promote the independence of investment research and as such is considered to be a marketing communication. Whilst it is not subject to any prohibition on dealing ahead of the dissemination of investment research we will not seek to take any advantage before providing it to our client. No representation or warranty is given as to the accuracy or completeness of this information and therefore it shouldn’t be relied upon as such. Any research provided does not have regard to specific financial situations, needs or investment objectives. Vantage accepts no responsibility for any use that may be made of these comments and for any consequences that result. Consequently, any person acting on it does so entirely at their own risk. We advise any readers of this material to seek professional advice where necessary. Without the approval of Vantage, reproduction or redistribution of this information isn’t permitted.
-

Open Trading Account
Discover the endless trading possibilities with our cutting-edge platform, designed to empower our traders. Practice trading the markets with a free demo account today.
-

Download Vantage App
Trade on the go with the Vantage All-In-One Trading App, where smooth execution and market access come together in the palm of your hand.
-

Start Trading
Are you an existing user? Login to your account to start trading 1,000+ CFD products including forex, indices, gold, shares and more.
