
 Register
 Login
Login Register


ASX Earnings preview: Can CBA Earnings Justify Its Premium?

Hebe Chen >
Senior Market Analyst
Hebe Chen >
Senior Market Analyst
 Updated Tue, 2025 August 12 05:00

Commonwealth Bank of Australia (ASX:CBA) is set to report its full-year earnings for the 12 months ending 30 June 2025 on Tuesday, 13 August.
CBA shares surged to a fresh all-time high of $191.53 in early June, driven by strong investor appetite for defensive yield names and growing expectations for a 2025 rate cut cycle. Since then, the rally has lost steam, with the stock pulling back modestly amid rising bond yields and renewed scrutiny over valuations.
Despite the recent pause, CBA remains the top performer among the Big 4 banks, with a year-to-date gain of +15.68% and a massive +39.21% increase over the past 12 months. That performance comes at a premium—CBA currently trades on a P/E of 31.16x, nearly double that of peers like NAB (14.33x), ANZ (17.6x), and Westpac (17.23x).
This valuation premium reflects the bank’s market dominance, digital leadership, and fortress balance sheet—but also raises the bar ahead of results. Investors will be watching closely to see if CBA can justify that multiple with a strong update on margin resilience, cost control, and capital return strategy.
Data up to 08/08/2025:
| Big 4 | Share price YTD | Share Price YoY | P/E |
| CBA | +15.68% | +39.21% | 31.16x |
| ANZ | +9.18% | +13.62% | 17.6 |
| WESPAC | +4.79% | +21.75% | 17.23 |
| NAB | +4.12% | +10.75% | 14.33 |
Solid First-Half Anchors Expectations
CBA delivered a steady first-half result in February that demonstrated resilience in the face of a cooling economy and stubborn inflation. Statutory net profit after tax came in at $5.14 billion, up 6% on the prior year, while cash NPAT rose 2% to $5.13 billion. Pre-provision operating profit was solid at $7.73 billion, supported by strong volume growth in core lending businesses and a modest uplift in margins.
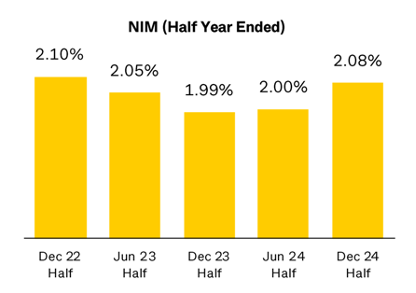
Notably, net interest margin (NIM) expanded by 9 basis points year-on-year to 2.08%, thanks to higher earnings on capital hedges and favourable replicating portfolio adjustments. While elevated competition for deposits weighed on funding spreads, consumer finance pricing and balance sheet mix helped offset the pressure. CBA also declared a $2.25 fully franked interim dividend, a 5% lift from the prior period.
What to Watch in the FY25 Full-Year Result
Investor focus is now turning to whether CBA can sustain this momentum through the second half of the year. A few key questions dominate:
First, can cost growth moderate after a heavy investment cycle in the first half? Markets will be looking for signs of a return to more stable expense trends as technology and compliance upgrades normalise.
Second, how well can margins hold up in the face of stiff deposit pricing competition and a flattening yield curve? Additional support from capital hedging and retail loan pricing will be critical.
Third, credit quality remains a wildcard. Although loan impairments stayed low in 1H25—just 7 basis points of gross loans—any uptick in arrears or forward-looking provisioning could challenge sentiment, especially amid ongoing cost-of-living pressure on households.
Finally, capital management will be in focus. With the $1 billion on-market buyback still underway and excess capital buffers in place, a more generous final dividend or accelerated repurchases could be on the table—especially if macro conditions stabilise.
Share Price: Range-Bound with Inflection Point in Sight
From a technical perspective, CBA is hovering just above its 50-day moving average and appears to be consolidating within a rising channel. The first layer of support is seen at $175.70, near the trendline base and previous swing low. A decisive break below this level may trigger a deeper pullback toward $168.73.

On the upside, resistance sits at $179.66, followed by $181.29 and $182.80—a key barrier from late July. A breakout through this zone could open the door for a retest of the record high near $191.53. Momentum indicators such as KDJ are showing early signs of bullish reversal but remain below overbought levels, suggesting further upside potential if earnings exceed expectations.
Disclaimer: The material provided here has not been prepared in accordance with legal requirements designed to promote the independence of investment research and as such is considered to be a marketing communication. Whilst it is not subject to any prohibition on dealing ahead of the dissemination of investment research we will not seek to take any advantage before providing it to our client. No representation or warranty is given as to the accuracy or completeness of this information and therefore it shouldn’t be relied upon as such. Any research provided does not have regard to specific financial situations, needs or investment objectives. Vantage accepts no responsibility for any use that may be made of these comments and for any consequences that result. Consequently, any person acting on it does so entirely at their own risk. We advise any readers of this material to seek professional advice where necessary. Without the approval of Vantage, reproduction or redistribution of this information isn’t permitted.
-

Open Trading Account
Discover the endless trading possibilities with our cutting-edge platform, designed to empower our traders. Practice trading the markets with a free demo account today.
-

Download Vantage App
Trade on the go with the Vantage All-In-One Trading App, where smooth execution and market access come together in the palm of your hand.
-

Start Trading
Are you an existing user? Login to your account to start trading 1,000+ CFD products including forex, indices, gold, shares and more.
