
 Register
 Login
Login Register


ASX 200 Surges as Inflation Cools, Peace Hopes Lift Risk Appetite

Hebe Chen >
Senior Market Analyst
Hebe Chen >
Senior Market Analyst
 Updated Wed, 2026 March 25 05:05

Preview: Technical Analysis on AUD/USD, Gold and Bitcoin
The Australian market is holding firmer into mid-week as easing inflation and tentative geopolitical developments provide support, though the broader macro backdrop remains finely balanced.
Australia’s February CPI showed a modest cooling in headline inflation, easing to 3.7% from 3.8%, signalling gradual progress on price pressures. However, the underlying picture remains less convincing. Trimmed mean inflation held at 3.3%, with housing (+7.2%) and services continuing to drive persistent cost pressures. Monthly CPI rose 0.2%, reinforcing that inflation is moderating — but not yet contained.
For the Reserve Bank, this keeps policy firmly in a data-dependent stance. Back-to-back hikes in February and March have shifted the cash rate to 4.10%, reflecting the Board’s resolve to address renewed inflationary pressures. The persistence of trimmed mean inflation suggests the Board remains on high alert — and today’s data, while directionally encouraging, does not yet clear the bar for a pause.
The S&P/ASX 200 moved higher into Wednesday, rising 1.3% at the open, with gains across nine of eleven sectors. Overnight, US equities advanced as reports of renewed diplomatic engagement between the US and Iran lifted expectations of potential de-escalation. Discussions around ceasefire conditions and Strait of Hormuz flows have begun to reshape short-term market expectations, even as a formal agreement remains uncertain.
Oil markets have responded quickly to that shift in tone. WTI crude declined back below $89, reversing earlier gains as diplomatic momentum offset immediate supply concerns. This leaves markets in a familiar position — stabilising at the surface while underlying risks remain unresolved and highly uncertain.
This week, we look at the following charts:
AUD/USD – Uptrend Holds but Momentum Softens
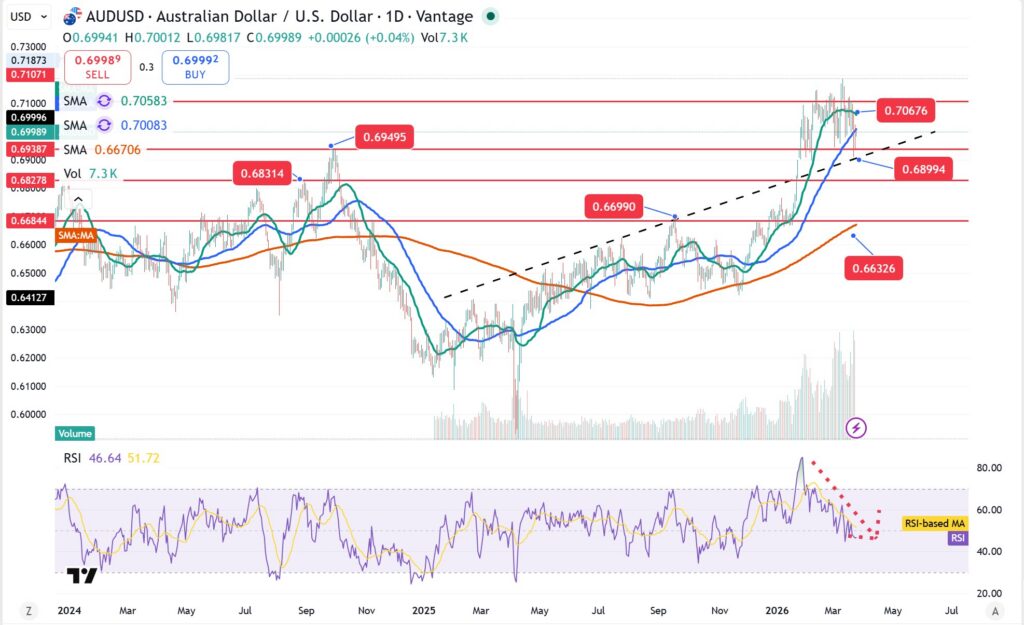
AUD/USD remains within a broader recovery structure, continuing to respect its ascending support trendline while consolidating below recent highs. The pair has struggled to sustain momentum above the 0.665–0.67 resistance zone, forming a short-term range.
The 20-day moving average is holding as immediate support, while medium-term averages remain upward sloping, preserving the broader bullish structure. However, RSI has eased toward neutral, signalling a loss of near-term momentum rather than a reversal.
Key support sits at 0.65, with stronger structural support below. A break above resistance would reopen upside toward recent highs, while failure to hold current levels would shift focus back to downside risks.
Gold – Trend Break Signals Deeper Consolidation Risk
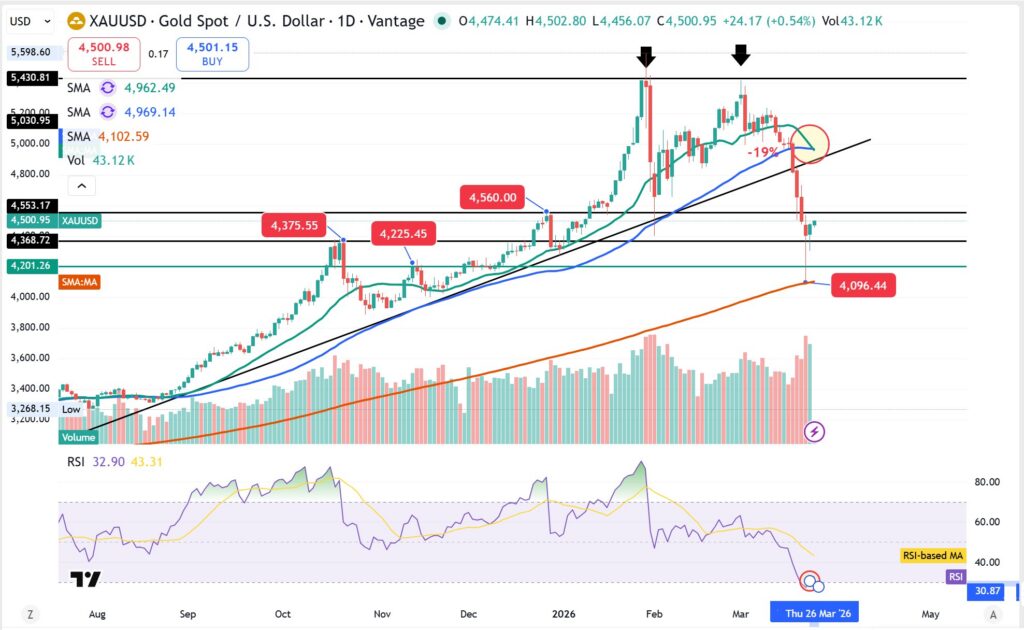
Gold has pulled back substantially from recent highs, with price action suggesting a potential shift in short-term structure after failing to sustain gains above key resistance.
The break below the ascending trendline signals a transition into consolidation, with price now testing key support zones. Momentum indicators have softened, with RSI moving lower, though not yet indicating capitulation.
The broader trend remains intact while price holds above major support levels, but the near-term setup points to a market reassessing direction rather than extending higher.
Gold is no longer reacting to peak fear — it is stabilising within a still-uncertain macro backdrop.
Bitcoin – Compression Near Key Breakdown Zone
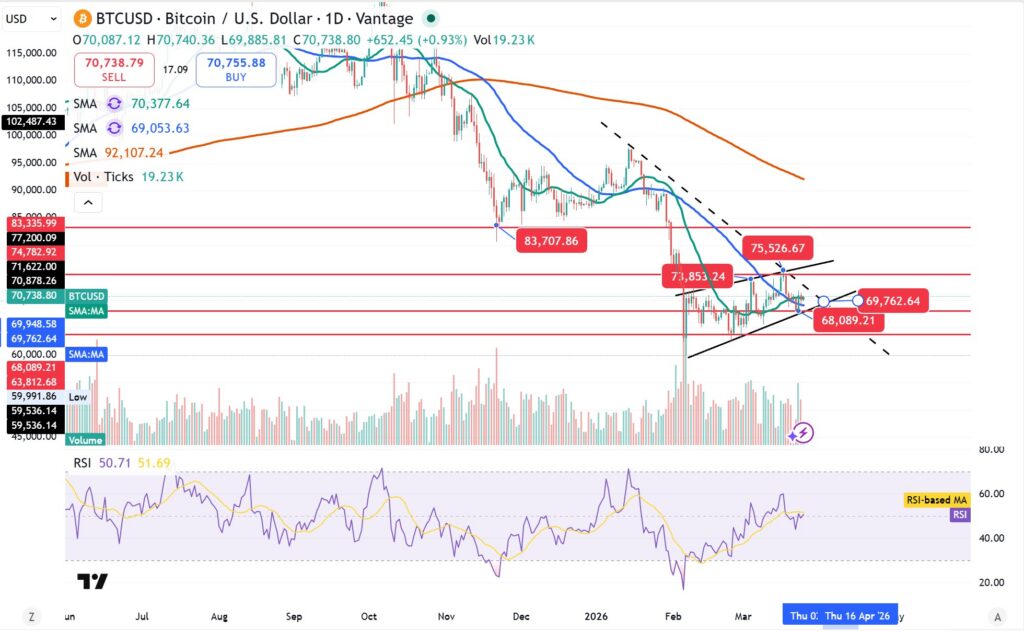
Bitcoin is trading within a tightening consolidation after its sharp decline from the 110K region, forming a potential descending triangle or wedge structure. Price is hovering between resistance at 75,500 and support around 68,000–69,700, with repeated tests on both sides narrowing the range. The short-term moving averages are flattening, reflecting indecision, while RSI stabilises near neutral levels. This is a classic compression phase following a strong move, where volatility is likely to expand. For now, the structure remains neutral — a break above resistance would ease downside pressure, while a loss of support could re-open the broader bearish trend.
Disclaimer: The material provided here has not been prepared in accordance with legal requirements designed to promote the independence of investment research and as such is considered to be a marketing communication. Whilst it is not subject to any prohibition on dealing ahead of the dissemination of investment research we will not seek to take any advantage before providing it to our client. No representation or warranty is given as to the accuracy or completeness of this information and therefore it shouldn’t be relied upon as such. Any research provided does not have regard to specific financial situations, needs or investment objectives. Vantage accepts no responsibility for any use that may be made of these comments and for any consequences that result. Consequently, any person acting on it does so entirely at their own risk. We advise any readers of this material to seek professional advice where necessary. Without the approval of Vantage, reproduction or redistribution of this information isn’t permitted.
-

Open Trading Account
Discover the endless trading possibilities with our cutting-edge platform, designed to empower our traders. Practice trading the markets with a free demo account today.
-

Download Vantage App
Trade on the go with the Vantage All-In-One Trading App, where smooth execution and market access come together in the palm of your hand.
-

Start Trading
Are you an existing user? Login to your account to start trading 1,000+ CFD products including forex, indices, gold, shares and more.
