
 Register
 Login
Login Register


ASX 200 Recovers Nicely on Monday

Christopher Lewis >
Market Analyst
Christopher Lewis >
Market Analyst
 Updated Tue, 2024 September 10 05:15

- ASX 200 bounces during lack of economic announcements on Monday.
- The market continues to see plenty of volatility.
- The quiet trading week could bring more of a “risk on attitude.”
The ASX 200 rallied significantly during the Monday session, as the AU$7900 level continues to be an area of extreme interest. The market has seen this area offer both support and resistance in the past, so it is probably not a huge surprise to technical traders that buyers would have showed up. Furthermore, it is probably worth noting that the 50 Day EMA has shown itself to be interesting as well, as the market has jumped above there.
The market finds itself dancing around the AU$8000 level, but it does look like the market is likely to continue to reach toward the AU$8100 level. That’s an area where we have seen resistance multiple times, and therefore if we to reach that region, one would anticipate that they should be some type of resistance or potential short-term ceiling getting in the way of the bullish traders.
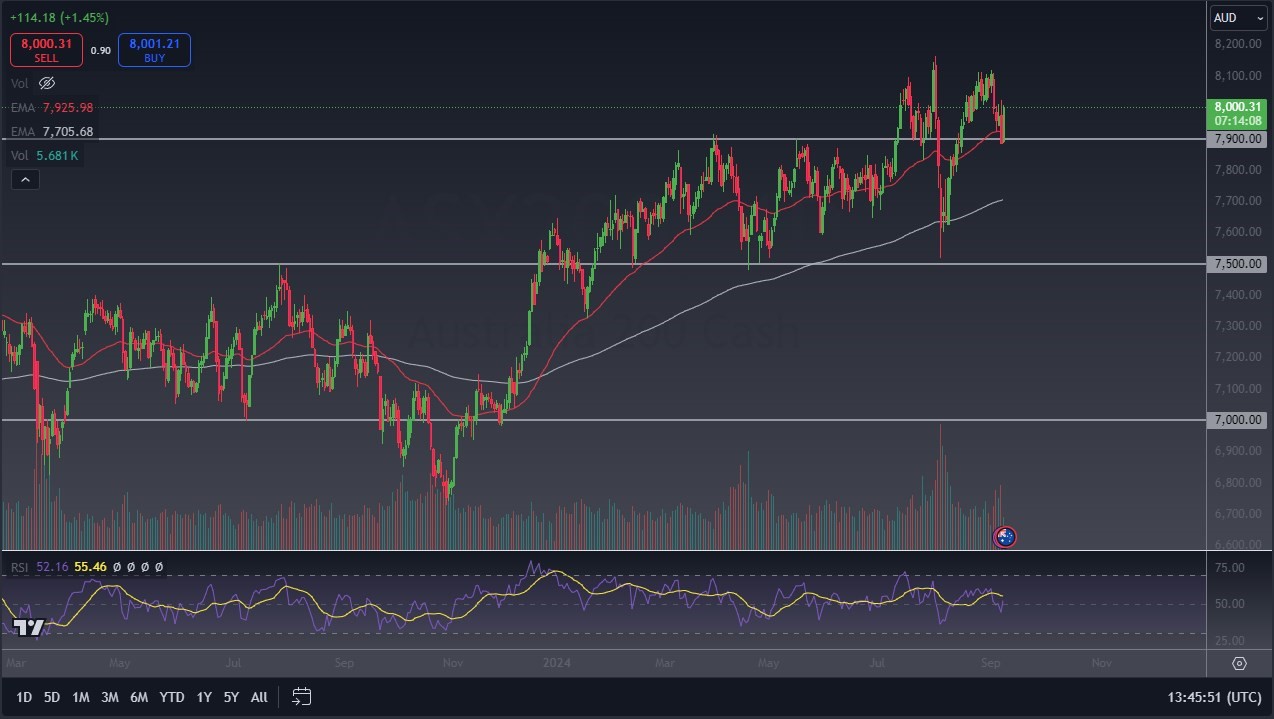
It’s probably worth noting that the economic calendar was all but empty on Monday, so this gave traders an opportunity to recover from the massive amount of selling that we had seen worldwide on Friday. In fact, this week is somewhat quiet overall, with Australia itself releasing nothing of note.
RIO Tinto (RIO)
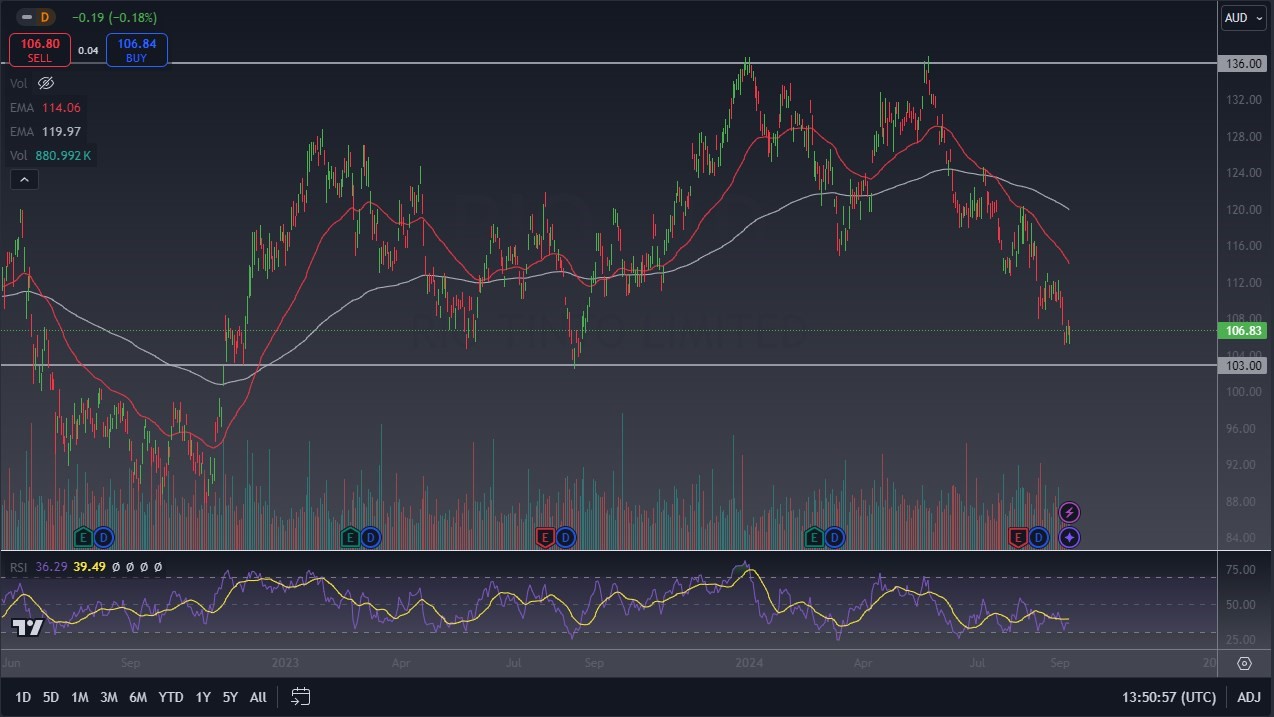
RIO Tinto rallied a bit during the early hours, but it still looks rather depressing, with the AU$103 level underneath offering significant technical support. The question now is whether or not the market can stay above this crucial level, because if it breaks down below there would be a massive technical breakdown. The market has been drifting lower for several months now, so value hunters might start to get interested in owning this asset if commodities start to pick up again, but with the economic situation so cloudy at the moment, some commodity companies will continue to struggle, perhaps extending its issues to this stock.
GMG Goodman Group (GMG)
Goodman Group rallied a bit during the early hours on Monday, gaining almost 7/10 of a percent, as the AU$32 level continues to offer massive amounts of support over the last couple of weeks. That being said, the 50 Day EMA sits just above so traders will be paying close attention to the AU$34 level. A break above there would be a technically bullish sign, and traders might start chasing this real estate company going forward. Underneath the crucial AU$32 level, we have the 200 Day EMA, which of course is a very important longer-term technical signal.

Pro Medicus (PME)
Pro Medicus rallied significantly during the Monday session, gaining a little over 1 ½%. By doing so, the stock has reached a new high, which could have momentum traders chasing it. The Relative Strength Index is in in the oversold condition yet, so it does look like momentum traders will be very interested in this market on dips, and it’s probably worth noting that the AU$150 level sits underneath like a major psychological support level and an area that will almost certainly attract a lot of attention if we get that region. That being said, after the candlestick on Monday, it certainly looks like there is a lot of confidence in this company.

Disclaimer: The material provided here has not been prepared in accordance with legal requirements designed to promote the independence of investment research and as such is considered to be a marketing communication. Whilst it is not subject to any prohibition on dealing ahead of the dissemination of investment research we will not seek to take any advantage before providing it to our client. No representation or warranty is given as to the accuracy or completeness of this information and therefore it shouldn’t be relied upon as such. Any research provided does not have regard to specific financial situations, needs or investment objectives. Vantage accepts no responsibility for any use that may be made of these comments and for any consequences that result. Consequently, any person acting on it does so entirely at their own risk. We advise any readers of this material to seek professional advice where necessary. Without the approval of Vantage, reproduction or redistribution of this information isn’t permitted.
-

Open Trading Account
Discover the endless trading possibilities with our cutting-edge platform, designed to empower our traders. Practice trading the markets with a free demo account today.
-

Download Vantage App
Trade on the go with the Vantage All-In-One Trading App, where smooth execution and market access come together in the palm of your hand.
-

Start Trading
Are you an existing user? Login to your account to start trading 1,000+ CFD products including forex, indices, gold, shares and more.
