
 Register
 Login
Login Register


ASX 200 Holds Steady as Key Stocks Face Mixed Pressure

Christopher Lewis >
Market Analyst
Christopher Lewis >
Market Analyst
 Updated Tue, 2025 December 2 05:53

- ASX 200: The index held steady near AU$8,700–AU$8,900 as traders awaited clearer global cues.
- ANZ Group Holdings: ANZ fell 1.27% on Monday and is down 6.69% this month but remains up 9.72% year-to-date.
- Woolworths Group: Woolworths dipped 0.21% and continues to hover around the AU$30 mark with firmer volume.
- Evolution Mining: Evolution Mining slid 1.94% but stays ahead with a 7.27% monthly gain and over 130% yearly growth.
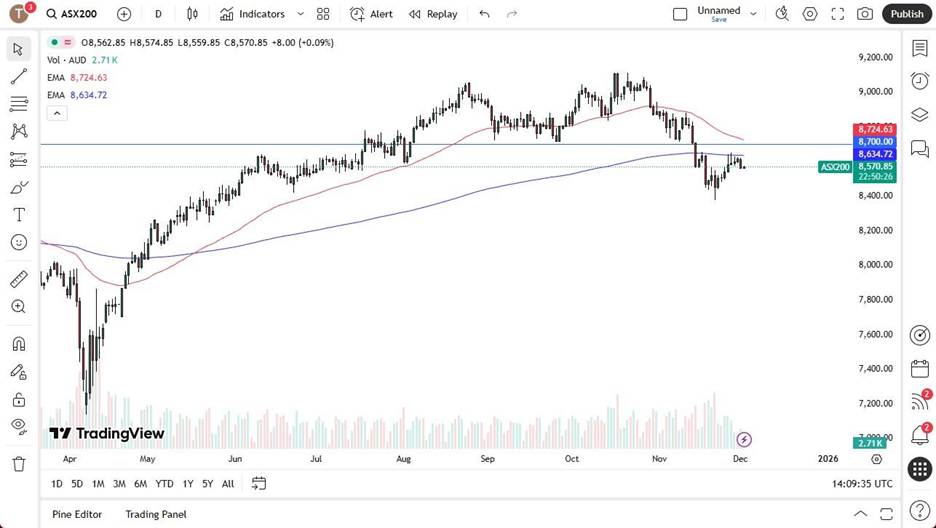
The ASX 200 opened the week in a quiet mood, with traders looking for a clearer sense of direction. The index has been sliding since mid-October, although brief rebounds have appeared along the way. Last week, the 200-day EMA acted as technical resistance, and it still seems to be a key hurdle.
The AU$8,700 area also appears challenging, with the 50-day EMA sitting just above it and adding another layer of resistance. These overlapping technical levels suggest that upward movement may continue to face hesitation in the near term.
If the index declines again, the AU$8,400 zone is likely to attract attention, as it served as support only a few weeks ago. Many traders still view this level as an important reference point, given the recent rebound from that area.
Sentiment remains a broader concern, as Australia continues to feel the effects of weaker confidence across global markets. This hesitancy weighs on smaller indices, creating a slower trading environment. Precious metals have shown some strength, offering a modest source of optimism, but the overall picture suggests the market is still waiting for a clear catalyst.
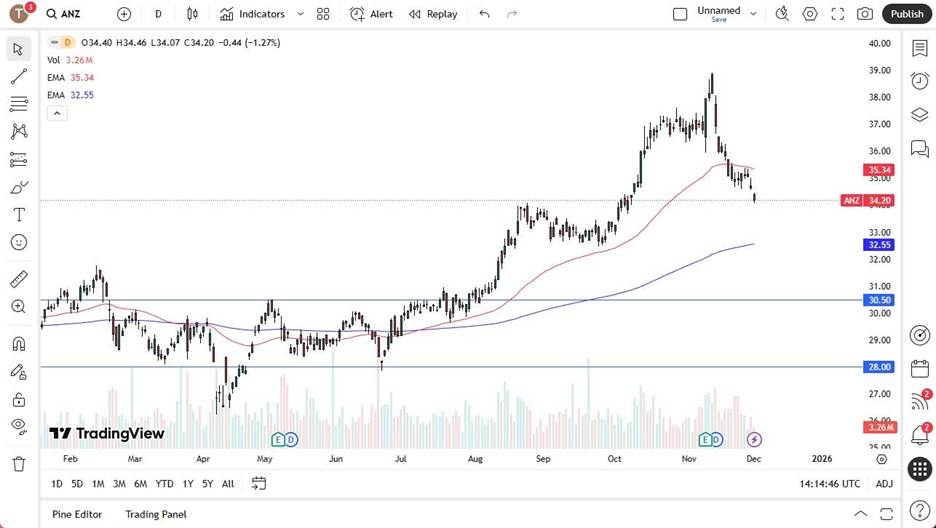
ANZ Group Holdings Limited (ANZ)
ANZ Group Holdings fell 1.27% on Monday, extending the decline seen over the past month. The share price has dropped 6.69% during that period, although it remains up 9.72% for the year. Movements continue to reflect shifting expectations around interest rates.
At this stage, the chart suggests the stock is slipping deeper into a downward phase. The AU$33 level stands out as a major support area that many market participants are watching closely.
The share price appears to be searching for a stable floor but has not yet shown signs of establishing one. Until that happens, volatility may remain elevated as sentiment reacts to broader economic signals.
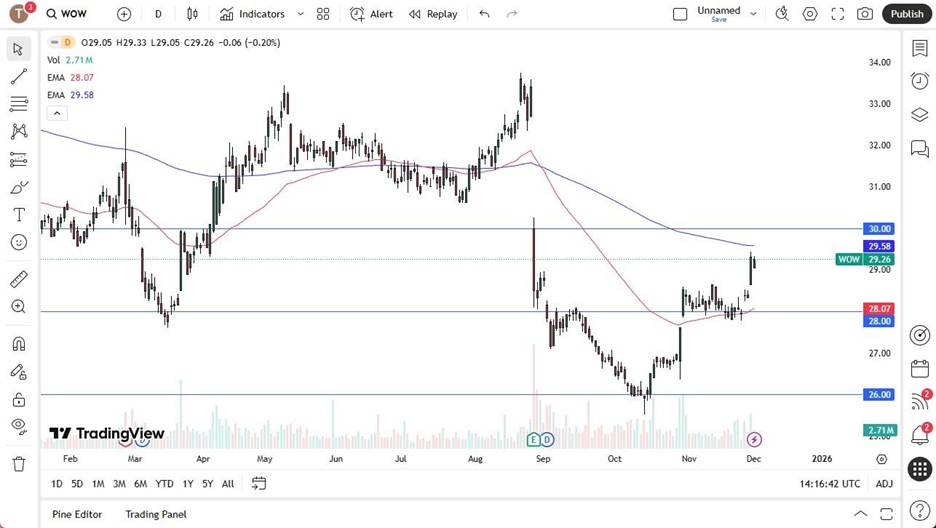
Woolworths Group Limited (WOW)
Woolworths Group slipped 0.21% on Monday as traders continued to search for clearer momentum. The company sits within the consumer staples sector, which some investors may be leaning on as broader market sentiment remains soft.
Although the session closed slightly lower, the price action showed some resilience. The market opened with a gap to the downside but managed to recover most of it fairly quickly.
Recent sessions have also shown a small increase in trading volume. This comes as WOW edges closer to the AU$30 level, which many will view as an important area to watch.
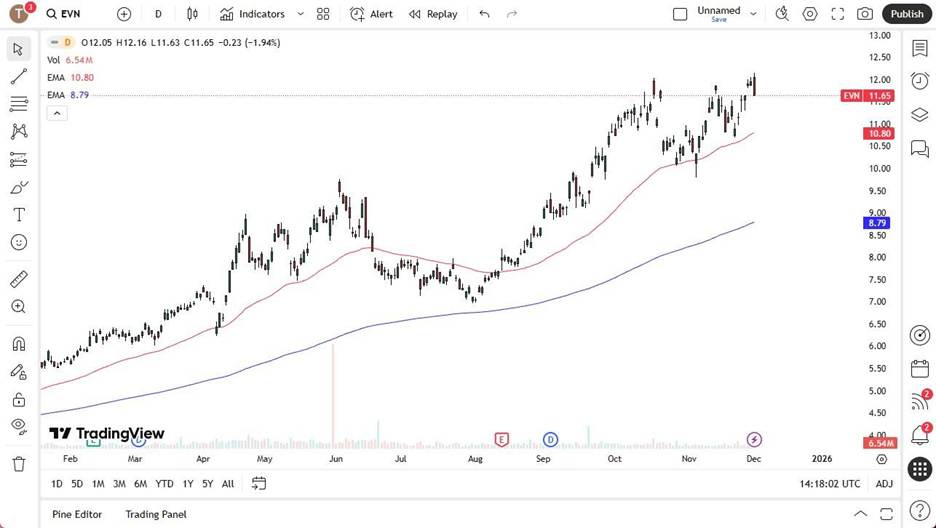
Evolution Mining Limited (EVN)
Evolution Mining Limited fell 1.94% on Monday, although the broader picture remains strong. The company has gained 7.27% over the past month and an impressive 130.24% over the past year.
Despite the weaker session, the stock touched a new high during Monday’s trade before easing back. This suggests the broader trend is still supported, particularly as gold prices continue to play an important role in shaping sentiment across the mining sector.
Many market participants may continue to monitor short-term pullbacks closely, given the strong performance seen over the past year. The key focus remains on how gold behaves from here, as it continues to guide movements in related mining names.
Disclaimer: The material provided here has not been prepared in accordance with legal requirements designed to promote the independence of investment research and as such is considered to be a marketing communication. Whilst it is not subject to any prohibition on dealing ahead of the dissemination of investment research we will not seek to take any advantage before providing it to our client. No representation or warranty is given as to the accuracy or completeness of this information and therefore it shouldn’t be relied upon as such. Any research provided does not have regard to specific financial situations, needs or investment objectives. Vantage accepts no responsibility for any use that may be made of these comments and for any consequences that result. Consequently, any person acting on it does so entirely at their own risk. We advise any readers of this material to seek professional advice where necessary. Without the approval of Vantage, reproduction or redistribution of this information isn’t permitted.
-

Open Trading Account
Discover the endless trading possibilities with our cutting-edge platform, designed to empower our traders. Practice trading the markets with a free demo account today.
-

Download Vantage App
Trade on the go with the Vantage All-In-One Trading App, where smooth execution and market access come together in the palm of your hand.
-

Start Trading
Are you an existing user? Login to your account to start trading 1,000+ CFD products including forex, indices, gold, shares and more.
