
 Register
 Login
Login Register


ASX 200 Continues to See Support Despite Mixed Sector Performance

Christopher Lewis >
Market Analyst
Christopher Lewis >
Market Analyst
 Updated Thu, 2024 September 12 04:46

- Stocks continue to be mixed although ASX 200 continues to see support.
- Commodities continue to look soft overall.
- Is the Australian consumer faring well?
During the trading session on Wednesday, the ASX 200 initially fell but in the managed to turn around and recapture the AU$8000 level. The 50 Day EMA currently sits just below it, just as the AU$7900 level does, both of which could very well offer quite a bit of technical support. Remember, the market has been fighting quite vehemently near the AU$7900 level over the last several months, and as a result the market has had a bit of a floor in it for the most part.

The market has been in a slow and grinding uptrend for some time, which does make a certain amount of sense as there are a lot of questions asked about commodities and global demand going forward. Remember, a huge portion of the inflows when it comes to the ASX 200 will be coming from overseas, and foreign traders tend to look at the Australian exchange as a way to play either the commodity markets, or growth in the Asia-Pacific region.
Commonwealth Bank of Australia (CBA)
Commonwealth Bank of Australia has had a brutal Wednesday, dropping almost 2% of the pullback. That being said, it is up just under 9% for the month, so it’s not exactly what most traders would look at as a major meltdown. Quite frankly, the market may have gotten ahead of itself as it is currently trading water near the AU$141 level.
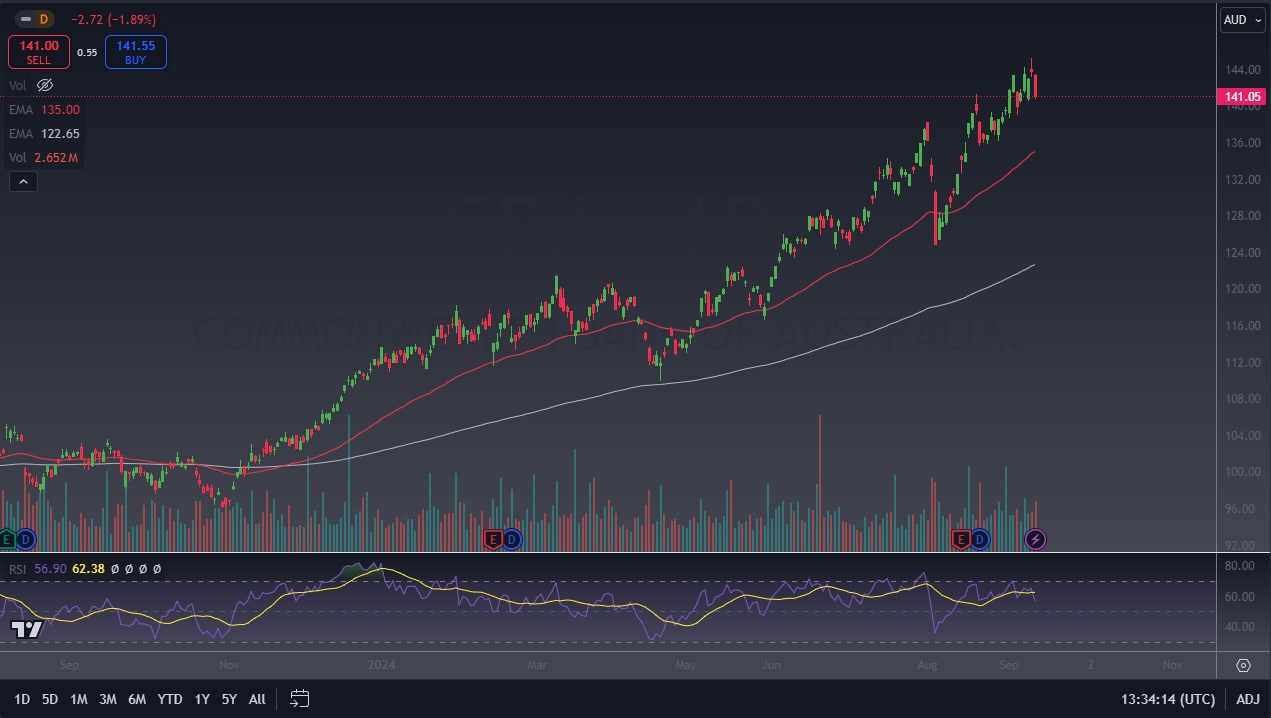
Keep in mind that CBA is typically a play on domestic demand for loans, and if we are going to continue to see central banks around the world cut rates, the idea of course is that construction may pick back up. CBA is well positioned to take advantage of this given enough time, and perhaps that’s what a lot of traders are paying attention to. That being said, just a few weeks ago CBA reported higher revenue than anticipated, but slightly lower earnings, which was a bit of a “washout” as to how traders positioned themselves. With the strong trend that CBA has seen, we could very well see more of a “buy on the dip” mentality as traders followed the longer-term trend.
Fortesque Ltd (FMG)
Fortesque has been falling quite drastically as of late, although it did gain 2.65% during the trading session on Wednesday. The recent selloff is a continuation of a big move lower from the AU$28 level down to the AU$16.76 level before a short-term bounce. However, August 28 featured the earnings report, which had seen earnings miss by 6.18% of estimates, and revenue miss by 2%. It looks as if the market continues to punish FMG, and in less economic growth starts to pick up, this stock may continue to be looked at with suspicion.

Woolworths Group Ltd (WOW)
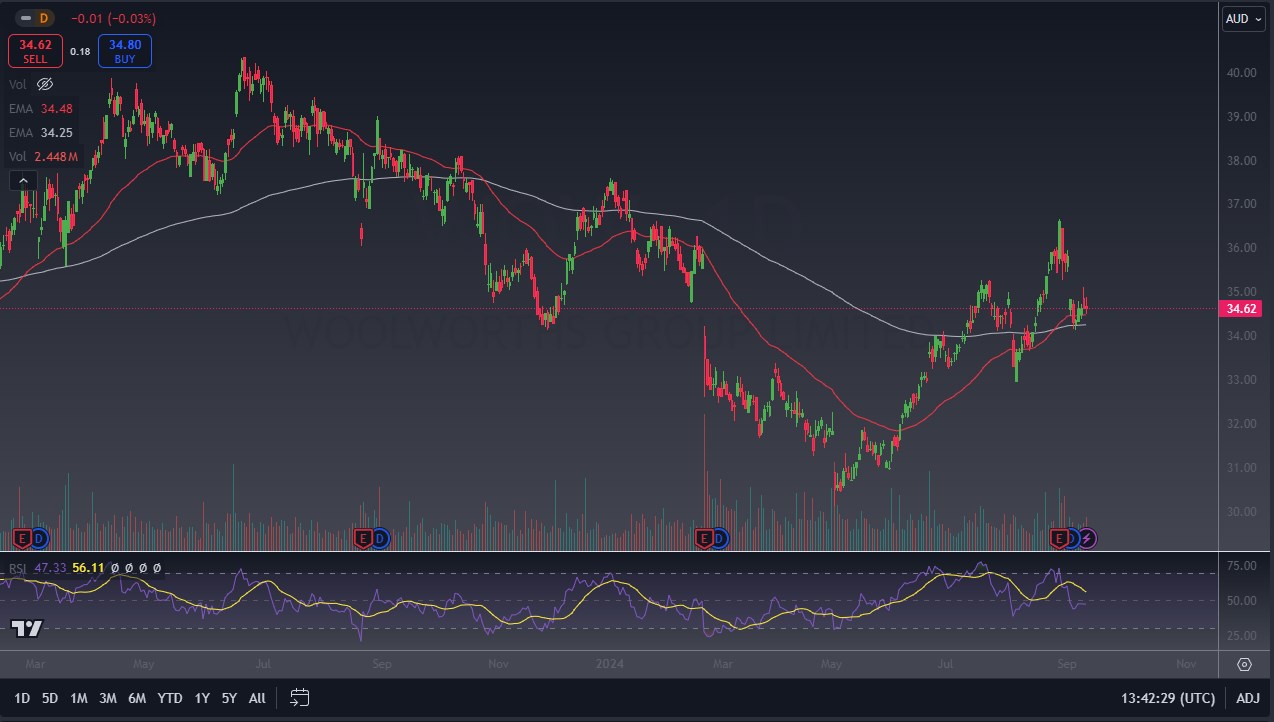
Woolworths Group was down just 3 basis points during the trading session on Wednesday, but it is worth noting that WOW is up just over 2% during the last month. Woolworths had mixed to earnings a few weeks ago, with a surprise of 2.41% more in revenue than anticipated, but at the same time earnings were down 4.97% from expectations. The consumer staples giant could be looked at through the prism of what’s going on with the domestic Australian economy, and therefore it is always worth keeping an eye on.
From a technical analysis standpoint, it’s probably worth noting that Woolworths is currently sitting at both the 50 Day EMA and the 200 Day EMA region, meaning that a lot of technical traders are probably also paying close attention to this market as it recently formed the so-called “golden cross.”
Disclaimer: The material provided here has not been prepared in accordance with legal requirements designed to promote the independence of investment research and as such is considered to be a marketing communication. Whilst it is not subject to any prohibition on dealing ahead of the dissemination of investment research we will not seek to take any advantage before providing it to our client. No representation or warranty is given as to the accuracy or completeness of this information and therefore it shouldn’t be relied upon as such. Any research provided does not have regard to specific financial situations, needs or investment objectives. Vantage accepts no responsibility for any use that may be made of these comments and for any consequences that result. Consequently, any person acting on it does so entirely at their own risk. We advise any readers of this material to seek professional advice where necessary. Without the approval of Vantage, reproduction or redistribution of this information isn’t permitted.
-

Open Trading Account
Discover the endless trading possibilities with our cutting-edge platform, designed to empower our traders. Practice trading the markets with a free demo account today.
-

Download Vantage App
Trade on the go with the Vantage All-In-One Trading App, where smooth execution and market access come together in the palm of your hand.
-

Start Trading
Are you an existing user? Login to your account to start trading 1,000+ CFD products including forex, indices, gold, shares and more.
