
 Register
 Login
Login Register


ASX 200 Continues to Hang Around the 50 Day EMA

Christopher Lewis >
Market Analyst
Christopher Lewis >
Market Analyst
 Updated Tue, 2024 August 13 04:52

- Stock markets pulled back worldwide on Monday.
- Commodities will have their part to play.
- Volatility likely to be a continuous problem.
The ASX 200 has initially pulled back just a bit during the trading session on Monday, but continues to hang around the 50 Day EMA indicator, an area that a lot of people will be paying attention to. The question at this point in time is going to be whether or not momentum can enter the market again, and perhaps send the ASX 200 to look above the crucial AU$7900 level. This is an area that has been important multiple times in both directions, so one would anticipate that there should be a certain amount of “market memory” in that region.

Other Equity Markets and Their Influence
Keep in mind that the entire financial system currently seems to be concerned about geopolitics, the global economy slowing, and many other issues involving central banks and the monetary policy coming from places like Washington, London, and of course Sydney. Because of all of this, it looks as if traders are a bit confused as to which direction to trade, and it is worth noting that the correlation between markets seems to be getting stronger, not weaker.
For example, the S&P 500 in the United States is currently racing toward the 5400 level, which is also where the 50 Day EMA indicator resides in that index. Because of this, there is a certain amount of resistance above that could come into the picture, and that could put a little bit of a dampening effect on risk appetite. Furthermore, the NASDAQ 100 hasn’t even reached the 50 Day EMA indicator, as it is currently hanging around the 18,500 level. In other words, the further you go out into the risk spectrum, the more difficult things get. Unfortunately for Australia, the ASX 200 is considered to be somewhat of a minor index, and it is much further out on the risk spectrum than many of the other major indices.


Commodities
Commodities, as per usual, will have their influence on Australian equities. It is worth noting that the copper market bounced over 2% during the trading session on Monday, but the reality is that the market has recently been hammered for a more than 20% loss. Because of this, we are starting to see a little bit of hope when it comes to the materials sector via the copper market, but there is quite a bit of work to be done still.

Iron continues to be extremely depressed, hanging around the $100 level. If iron can join the bounce from copper, that could give a little bit more boost to the materials sector in Australia as well, and then of course we need to see coal do a bit better as well. Gold markets have played their part, but in a twist of irony, higher gold prices might actually work against Australia overall, as it seems like traders are jumping into the gold market for protection.

Global Volatility
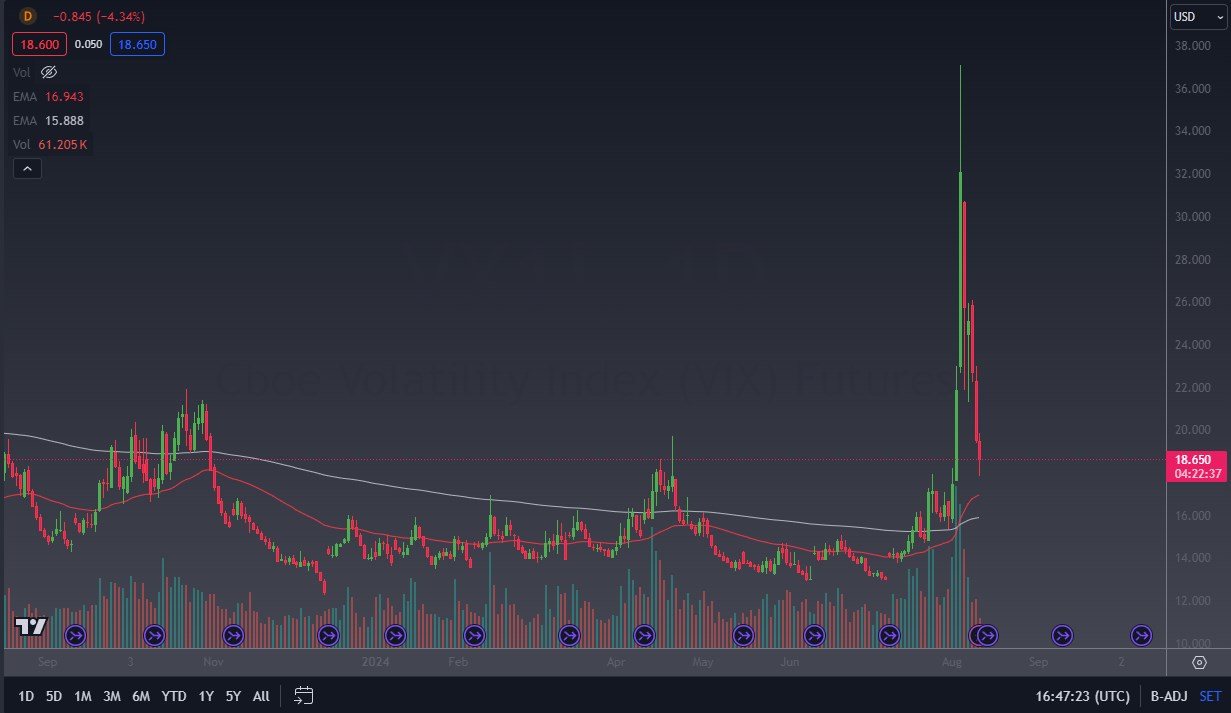
While global volatility remains elevated, one of the most common standards for measuring how much fear there is out there would be the VIX. While it measures the S&P 500 specifically, the reality is that we had recently spiked to extreme levels, only to crash down below the 28 level again. On Monday, we dropped a bit, but it also looks like we are bouncing from the lows in an area that might end up showing support for more volatility going forward. In the end, it looks like we are not through with volatility and that will certainly be felt in Australia.
Disclaimer: The material provided here has not been prepared in accordance with legal requirements designed to promote the independence of investment research and as such is considered to be a marketing communication. Whilst it is not subject to any prohibition on dealing ahead of the dissemination of investment research we will not seek to take any advantage before providing it to our client. No representation or warranty is given as to the accuracy or completeness of this information and therefore it shouldn’t be relied upon as such. Any research provided does not have regard to specific financial situations, needs or investment objectives. Vantage accepts no responsibility for any use that may be made of these comments and for any consequences that result. Consequently, any person acting on it does so entirely at their own risk. We advise any readers of this material to seek professional advice where necessary. Without the approval of Vantage, reproduction or redistribution of this information isn’t permitted.
-

Open Trading Account
Discover the endless trading possibilities with our cutting-edge platform, designed to empower our traders. Practice trading the markets with a free demo account today.
-

Download Vantage App
Trade on the go with the Vantage All-In-One Trading App, where smooth execution and market access come together in the palm of your hand.
-

Start Trading
Are you an existing user? Login to your account to start trading 1,000+ CFD products including forex, indices, gold, shares and more.
