
 Register
 Login
Login Register


ASX 200 & Aussie Dollar September Outlook: Can Markets Defy the Seasonal Swoon?

Hebe Chen >
Senior Market Analyst
Hebe Chen >
Senior Market Analyst
 Updated Fri, 2025 August 29 03:32

What’s September Effect?
Seasonal patterns are hard to ignore. September has long carried the reputation of being one of the weakest months for equities.
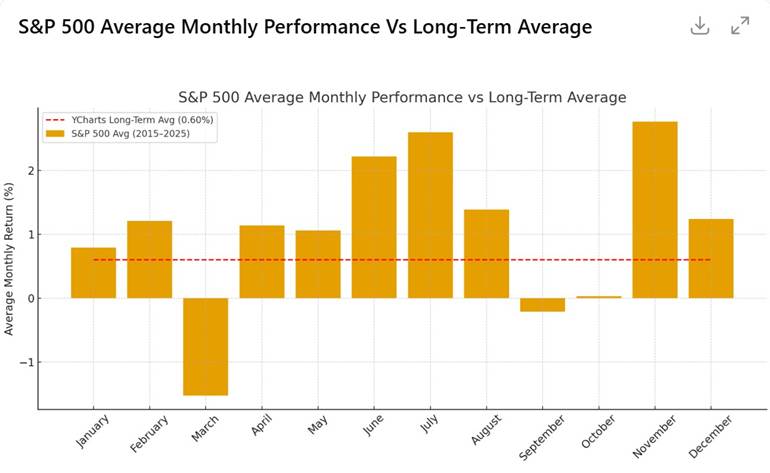
The S&P 500’s monthly performance shows that while summer months like June and July often deliver strong gains, September is one of the weakest periods, averaging negative returns. From 1928 through 2023, the S&P 500 declined in 55% of Septembers, making it the only month with a majority of negative outcomes. In the recent decade (see below chart), September is also showing the seasonal pattern with average return in negative, only beating March.
For Australian shares, the pattern is often referred to as the “September Swoon.” Over the past 40 years, the All Ordinaries Total Return Index (XAOA) averaged a –0.11% return in September, with gains recorded just 52.5% of the time. This makes it the least consistent month for Australian equities, contrasting with the strength typically seen in July and August.
September 2025 Key Events Preview
August wrapped up with fireworks across global markets with both Wall Street and Australian shares continuing to record new highs, and thus September opens with the stakes even higher. Investors now face a new month crowded with economic signals and central bank decisions that could either fuel the rally or expose fresh cracks.
Below is the key event and release in the calendar:
- Australia Q2 GDP (Sept 3): With Q1 growth at just 0.2%, another weak print could lock in expectations of deeper RBA cuts. Markets already price 1-2 more rate cuts to bring interest rate below 3.1% by year-end.
- US Jobs Report (Sept 5): A soft read would all but guarantee a Fed cut in September, weighing on the dollar and fuelling gold’s appeal.
- Fed Decision (Sept 18): A rate cut is nearly fully priced in. But a “hawkish cut” — easing paired with caution — could sap enthusiasm and stall equities.
- Australia’s unemployment data (Sept 18): Labour market conditions will be critical for the pace and level of urgency for RBA’s next rate cut schedule.
- Australia CPI (Sept 24) & US PCE (Sept 26): These inflation gauges will act as decisive checkpoints. Another upside surprise in Australia could complicate the RBA’s easing path, while the US PCE will shape Fed positioning heading into Q4.
- RBA Meeting (Sept 30): This meeting will be pivotal in reshaping market expectations for the pace and timeline of further cuts. The RBA’s response to the recent inflation flare‑up will be closely watched, and its guidance will set the tone for the AUD’s trajectory and broader sentiment heading into year‑end.
ASX 200 Technical Outlook
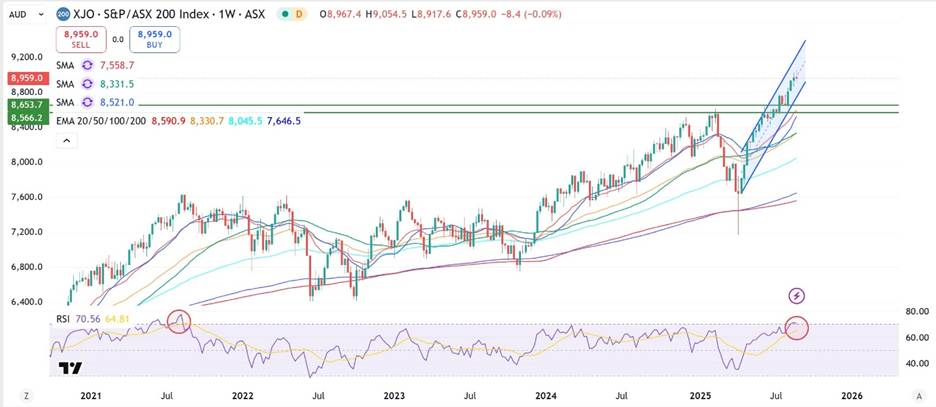
The ASX 200 has staged an impressive rally in August, breaking above the 9000 milestone and trading within a steep ascending channel. Weekly candles show consistent higher highs and higher lows, but momentum indicators suggest caution. The RSI is hovering near 70, a level that has historically signaled overbought conditions and preceded pullbacks. Strong support lies around 8,566-8653, aligned with the 50-day and 100-day moving averages. A decisive break below this zone would suggest a cooling phase, while sustained closes above 9,000 could open the path toward fresh highs, though the risk of exhaustion is building.
AUD/USD Technical Outlook
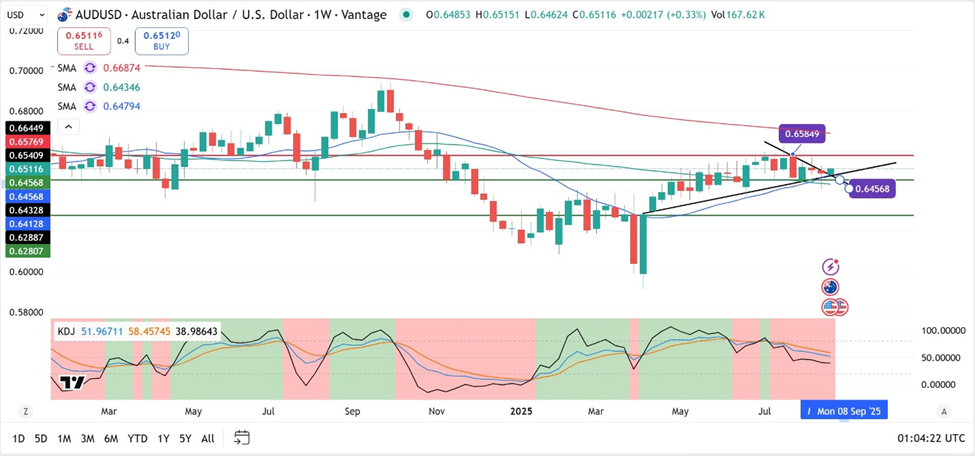
AUD/USD continues to trade in a tight range around 0.65, caught between fading upside momentum and firm support. The pair recently tested resistance around 0.6549 but failed to break through, slipping back toward its 50-week moving average at 0.6456. The KDJ oscillator shows signs of consolidation, with momentum flattening after a brief bullish turn. A break above 0.6585 would target the 0.6600 resistance zone, while failure to hold above 0.6450 risks a retest of the 0.6430 support. The RBA’s upcoming policy decision, Australia’s jobs report and inflation data, together with the Fed’s message at the September 17 meeting, will profoundly reshape the direction
Outlook
Both the ASX 200 and AUD/USD face a convergence of seasonal weakness and critical macro events in September. While technicals show resilience in equities and a stabilizing Aussie dollar, elevated risks mean volatility is likely to rise. Investors should remain nimble, watching key support and resistance levels closely as markets step into a month with a historically poor track record.
Disclaimer: The material provided here has not been prepared in accordance with legal requirements designed to promote the independence of investment research and as such is considered to be a marketing communication. Whilst it is not subject to any prohibition on dealing ahead of the dissemination of investment research we will not seek to take any advantage before providing it to our client. No representation or warranty is given as to the accuracy or completeness of this information and therefore it shouldn’t be relied upon as such. Any research provided does not have regard to specific financial situations, needs or investment objectives. Vantage accepts no responsibility for any use that may be made of these comments and for any consequences that result. Consequently, any person acting on it does so entirely at their own risk. We advise any readers of this material to seek professional advice where necessary. Without the approval of Vantage, reproduction or redistribution of this information isn’t permitted.
-

Open Trading Account
Discover the endless trading possibilities with our cutting-edge platform, designed to empower our traders. Practice trading the markets with a free demo account today.
-

Download Vantage App
Trade on the go with the Vantage All-In-One Trading App, where smooth execution and market access come together in the palm of your hand.
-

Start Trading
Are you an existing user? Login to your account to start trading 1,000+ CFD products including forex, indices, gold, shares and more.
