
 Register
 Login
Login Register


Apple Q3 Earnings Preview: Margin Pressures, AI Lag, and a China Market Check-up

Hebe Chen >
Senior Market Analyst
Hebe Chen >
Senior Market Analyst
 Updated Mon, 2025 July 28 05:41

After a volatile quarter that saw Apple tumble to its yearly low before reclaiming key technical levels, the iPhone maker heads into its fiscal Q3 2025 earnings with cautious optimism building in the market.
Apple Earnings Date
Apple is scheduled to report Q3 FY2025 earnings (for the quarter ending June 2025) after the market close on Wednesday, July 31,2025.
Apple Earnings Expectations
Apple reported $95.36 billion in net sales last quarter, up 5% YoY, driven by:
- iPhone sales: $46.84B, up 1.9% YoY
- Mac and iPad: Rebounded modestly (+6.7% and +15.1% YoY, respectively)
- Services: A standout at $26.65B, up 11.7% YoY
- Net income: $24.78B (+4.8% YoY)
- Gross margin: 47%, marginally up from 46.5% same quarter last year
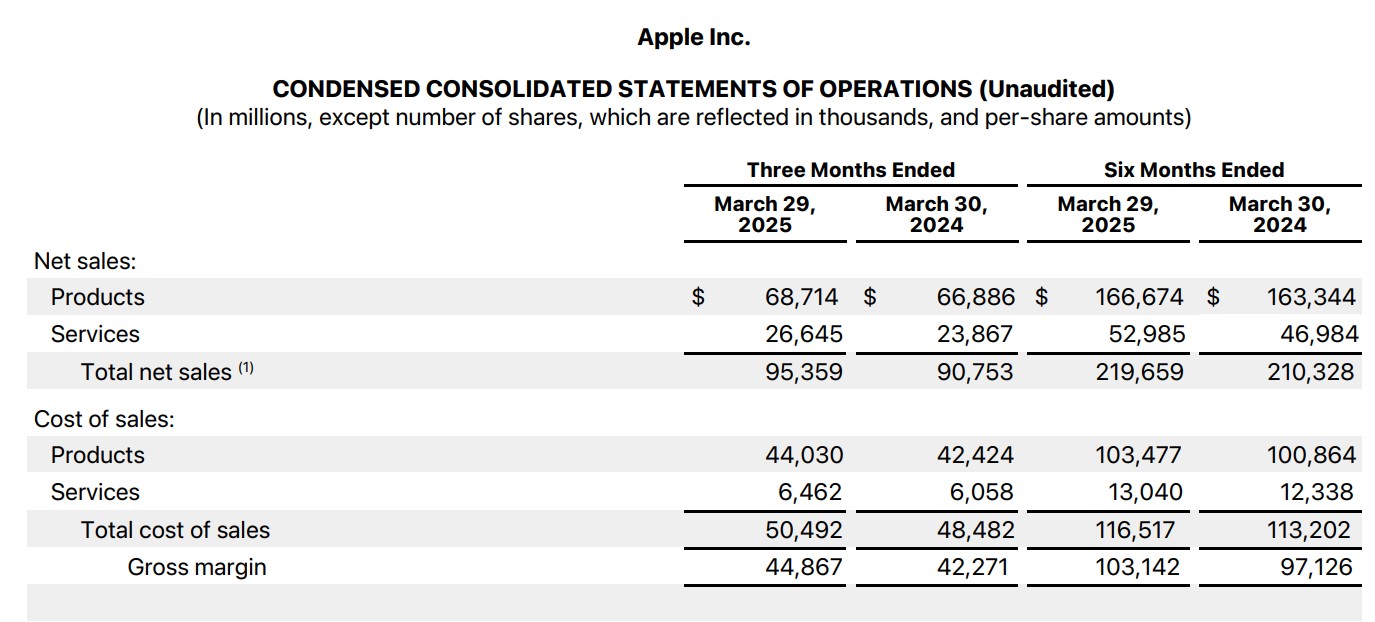
For this quarter, forward estimates suggest revenue of $88.5B–$89B and EPS between $1.42–$1.45, with gross margin guidance around 45.5%–46.5%, factoring in roughly $900 million in tariff-related costs.
Key Earnings Watch Points
Services Momentum vs. Regulatory Challenges
Apple’s Services segment remains the company’s most consistent growth engine. Services now accounts for nearly 28% of total revenue, a notable shift from Apple’s traditional hardware reliance. For the six-month period ending March 2025, Services revenue reached $52.99 billion, up 12.8% compared to the same period last year ($46.98 billion).
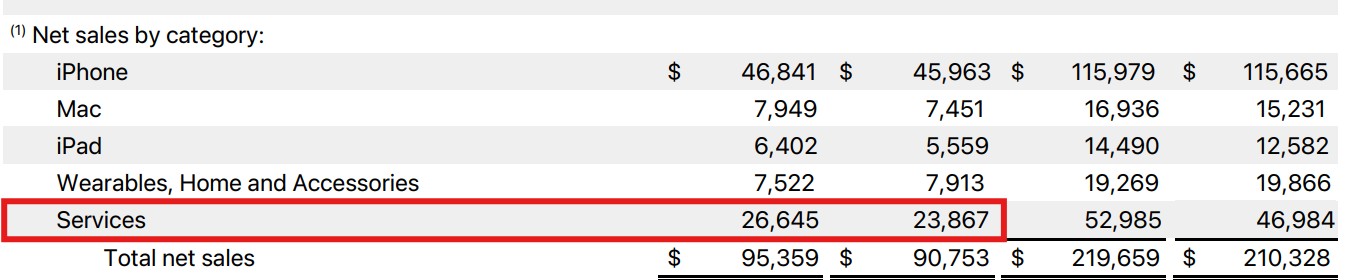
Growth has been driven by strong performance across paid subscriptions, App Store activity, AppleCare, and digital content. Apple recently surpassed 1.1 billion paid subscriptions, marking a new high and reinforcing the segment’s scale and recurring revenue appeal.
However, this momentum faces growing headwinds. Ongoing regulatory scrutiny—particularly tied to App Store commissions and antitrust rulings across the U.S. and EU—poses risks to Apple’s take-rate and operational control. The company may be forced to alter pricing structures, allow third-party payment systems, or adjust user tracking policies, all of which could weigh on monetization efficiency.
China Market: Rebound with Uncertainty
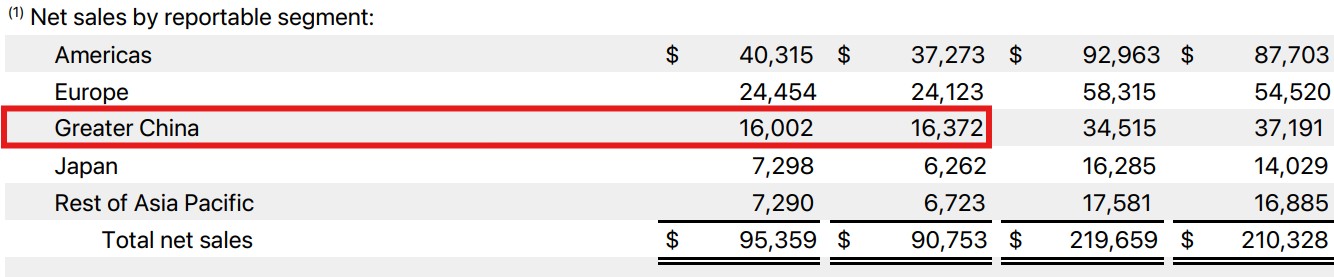
While iPhone sales reportedly rose 8% YoY in the last quarter on the back of aggressive promotions, average selling prices are under pressure amid intensifying local competition and deflationary pricing. Apple’s revenue from Greater China came in at $16.00 billion, down 2.3% YoY, the only region on the backfoot. With China’s market still stuck in a deflationary cycle, sustaining profitability remains a key challenge despite signs of volume recovery.
AI Execution Gap
While rivals race ahead in AI integration, Apple has taken a cautious stance. Investors will focus on any updates related to on-device AI features, partnerships, or hardware-level enhancements for the future product strategy.
Apple (AAPL) Technical Setup
Apple shares have staged a notable recovery from their April low, bouncing off the $170s and now trading near $214, brushing up multiple resistance from the short and long-term EMAs.
Ahead of earnings, the price is testing a key gap between $213 and $221—a zone it needs to clear to confirm a breakout and fully recover from April’s tumble. A breakout above $221.11 could signal renewed momentum, but failure to clear may trigger consolidation toward $210.11 or the 50-day EMA at ~$207.
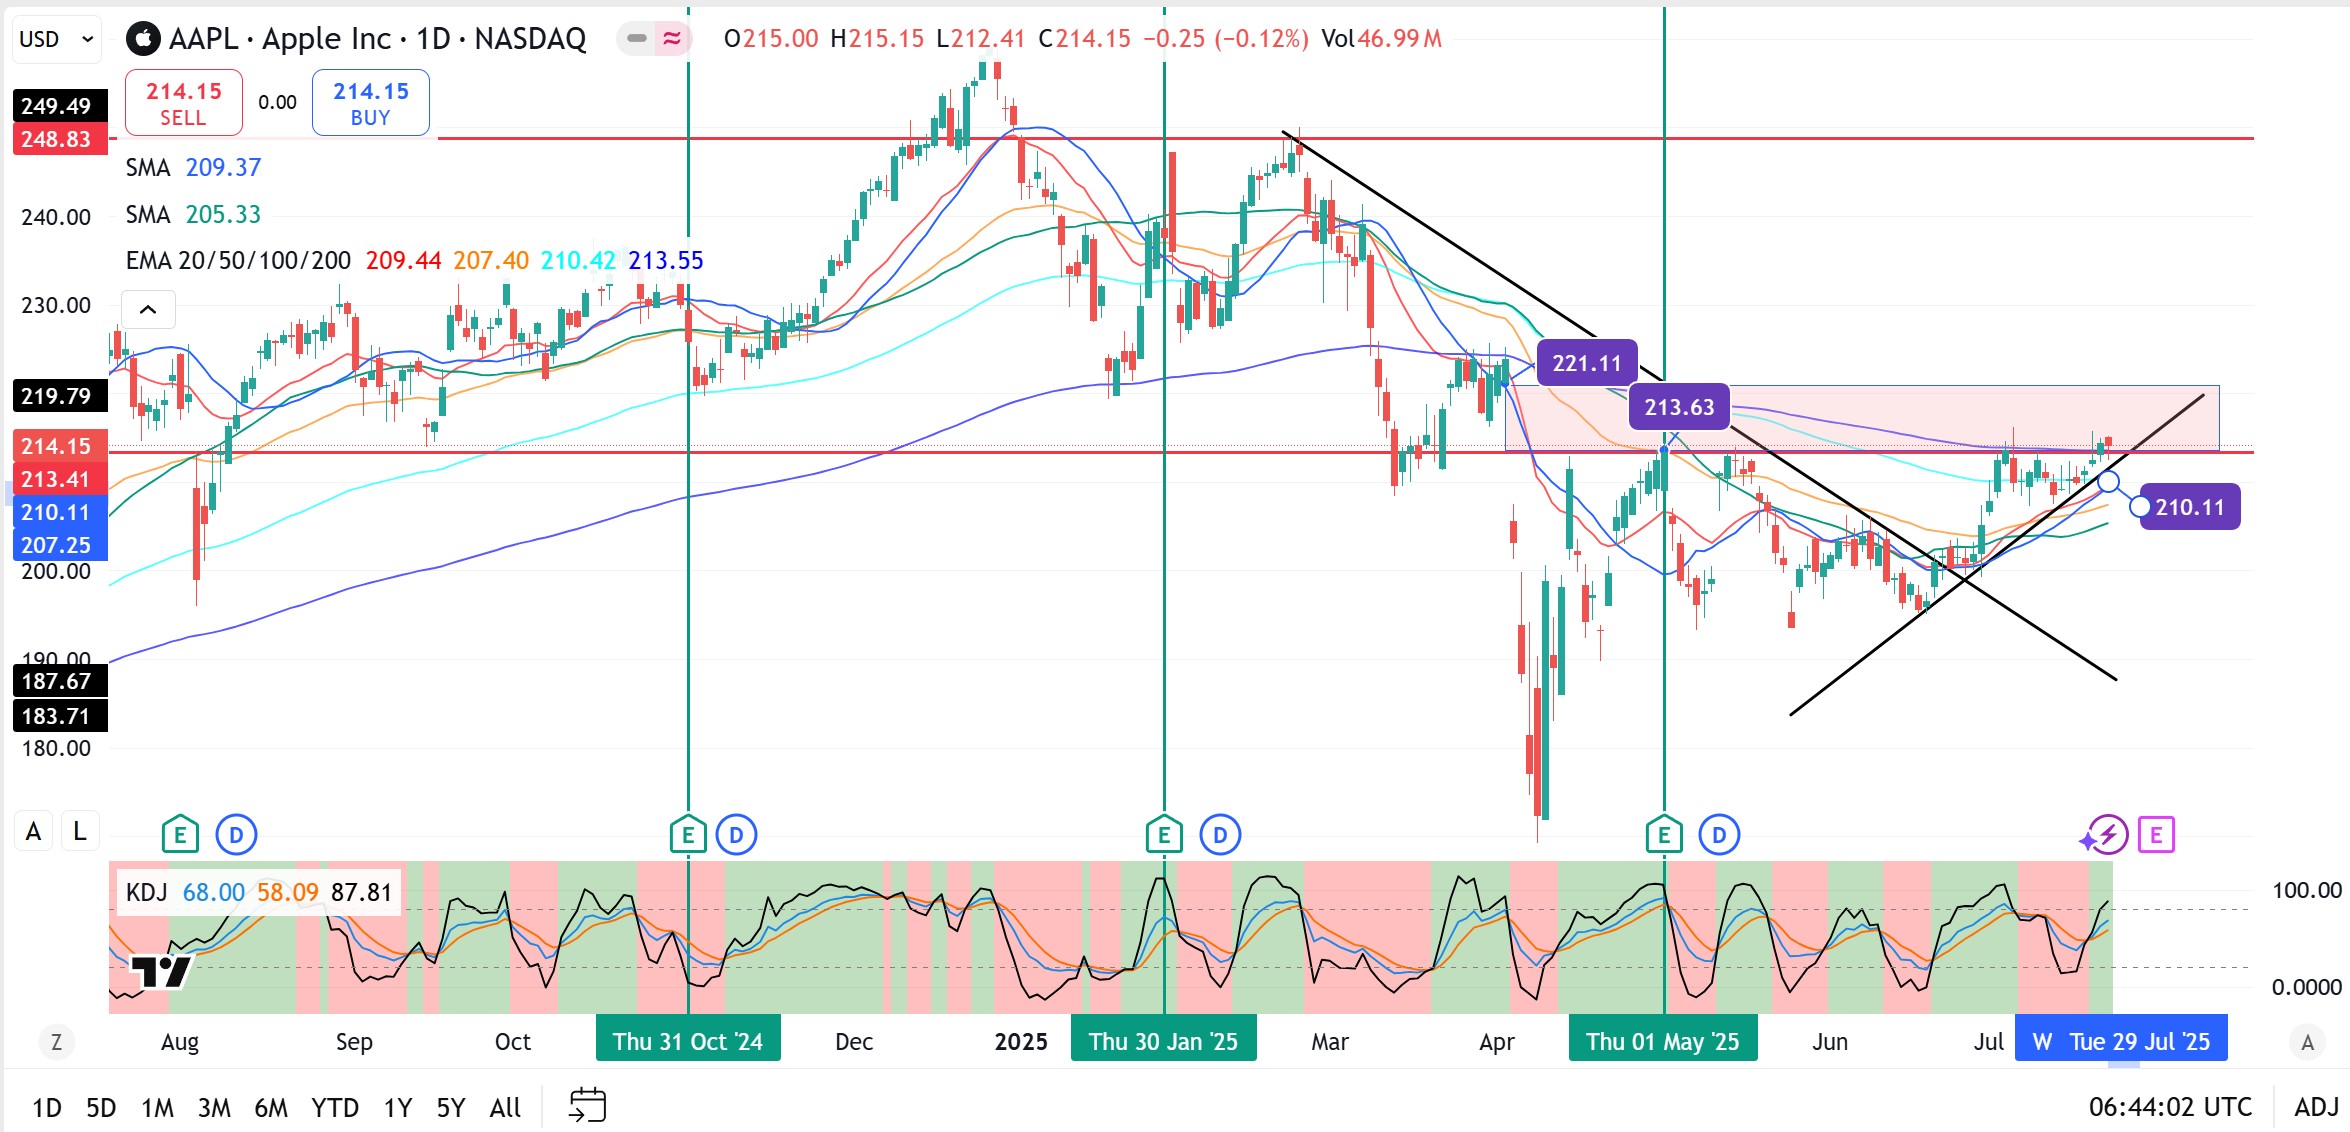
The KDJ indicator is approaching overbought territory (K=68, D=58), suggesting a pause or minor pullback could be imminent. All major EMAs are trending upward, with the 20/50/100-day lines supporting a bullish short- to medium-term bias.
Historically, Apple’s post-earnings performance has been mixed. Over the last six quarters, AAPL has gained on earnings day four times, with an average move of ±3.4%. The most recent report in April triggered a +6.2% rally, fueled by stronger-than-expected iPhone sales in China and robust Services growth. However, three of the past six post-earnings moves were faded within a week, reflecting investor hesitation at higher valuations.
Summary
Apple’s fundamentals remain strong, with solid earnings growth and deep cash reserves. But with multiple breeding headwinds, including the subdued growth in the product sector, the uncertainty in the Chinese market as well as the heat-up AI contest, a beat alone may not be enough—forward guidance on innovation and cost headwinds will determine whether AAPL can finally break out of its multi-month ceiling.
Disclaimer: The material provided here has not been prepared in accordance with legal requirements designed to promote the independence of investment research and as such is considered to be a marketing communication. Whilst it is not subject to any prohibition on dealing ahead of the dissemination of investment research we will not seek to take any advantage before providing it to our client. No representation or warranty is given as to the accuracy or completeness of this information and therefore it shouldn’t be relied upon as such. Any research provided does not have regard to specific financial situations, needs or investment objectives. Vantage accepts no responsibility for any use that may be made of these comments and for any consequences that result. Consequently, any person acting on it does so entirely at their own risk. We advise any readers of this material to seek professional advice where necessary. Without the approval of Vantage, reproduction or redistribution of this information isn’t permitted.
-

Open Trading Account
Discover the endless trading possibilities with our cutting-edge platform, designed to empower our traders. Practice trading the markets with a free demo account today.
-

Download Vantage App
Trade on the go with the Vantage All-In-One Trading App, where smooth execution and market access come together in the palm of your hand.
-

Start Trading
Are you an existing user? Login to your account to start trading 1,000+ CFD products including forex, indices, gold, shares and more.
