[DAILY TRADING] Silver Near $69, 16 June 2026 – Iran Deal Meets Fed Decision
Vantage Editorial Team >
Vantage Editorial Team >
Vantage is a global, multi-asset broker with a team of in-house writers and market analysts who produce educational and insightful trading content for traders of all levels.
![[DAILY TRADING] Silver Near $69, 16 June 2026 – Iran Deal Meets Fed Decision](https://www.vantagemarkets.com/wp-content/uploads/2026/06/XAGUSD_banner_900x430_optimized.webp)
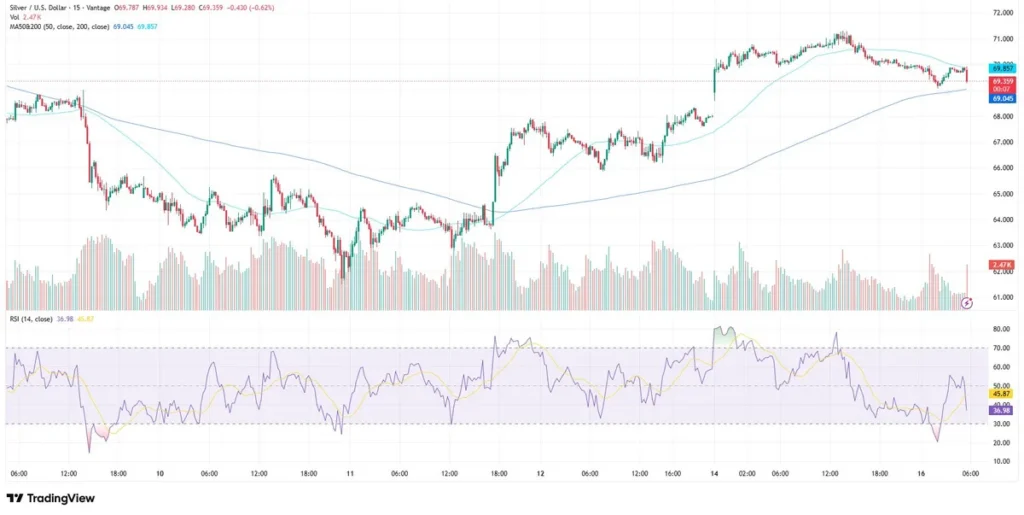
Silver (XAGUSD) traded at $69.36 per ounce on the Vantage XAGUSD CFD as of 05:44 UTC (13:44 GMT+8) on 16 June 2026, down 0.62% on the session after reaching a high of $69.93. That follows a recovery from the 9 June low near $63, with a significant portion of the move already underway before the US-Iran ceasefire on 14 June accelerated the advance.
The silver price today is caught between two opposing forces: an inflation number that keeps rate-cut hopes firmly shelved, and a geopolitical thaw that has reduced energy-market stress. The result is a market caught between improving geopolitical sentiment and a monetary-policy outlook that remains restrictive.
All prices are from the Vantage XAGUSD CFD and chart readings attributed to the TradingView setup used for this analysis as of 16 June 2026, 05:44 UTC. This is not financial advice.
Key Points
- Silver price (XAGUSD) recovered from a low near $63 on 9 June to a peak near $71 by 15 June 2026, with the US-Iran ceasefire on 14 June coinciding with improved risk sentiment across commodity markets.
- US May 2026 headline CPI came in at 4.2% year-on-year, the highest since April 2023, reinforcing a higher-for-longer rate view that continues to raise the opportunity cost of holding non-yielding metals like silver.[1]
- The FOMC meeting on 16-17 June, Kevin Warsh’s first as Fed Chair, is expected to hold rates at 3.50%-3.75%, but the updated dot plot and press conference at 14:30 ET on 17 June are the primary event risk for XAGUSD this week.[2]
Silver price chart: Three phases in seven days
The 15-minute XAGUSD silver price chart from 9 to 16 June 2026 divides cleanly into three phases. From 9 to 11 June, price slid from roughly $69 to a trough near $63, with both the 15-minute 50-period MA and 200-period MA sloping downward and the RSI per the TradingView setup used for this analysis falling into the mid-20s.
The ceasefire period coincided with a strong advance that ultimately carried silver from the mid-$60s into the $70-$71 area, with the 15-minute 50-period MA crossing above the 200-period MA on elevated volume per the Vantage CFD feed. Since then, silver has pulled back slightly.
As of 05:44 UTC on 16 June 2026, the 15-minute 50-period MA sits at 69.045, the 200-period MA at 69.857, and the RSI at 36.98 (fast) and 45.87 (signal), both below the 50 midline, reflecting cooled momentum from the rally peak. Learn how to invest in silver here.
What’s driving the silver price today
US-Iran ceasefire: oil falls, silver rebounds
The ceasefire framework reached on 14 June 2026 included provisions for reopening the Strait of Hormuz, through which roughly 20% of global oil supply transits.[3] Oil dropped more than 4% on the announcement.
Lower oil prices may reduce inflation concerns at the margin, although silver remains more directly influenced by real yields, the US dollar, industrial-demand expectations, and broader risk sentiment. The deal is scheduled for formal signing in Switzerland on 19 June, with terms reportedly covering sanctions relief and the dismantling of Iran’s nuclear programme.[3]
4.2% CPI: the inflation ceiling is still there
US headline CPI rose to 4.2% year-on-year in May 2026, per the Bureau of Labor Statistics, the highest print since April 2023.[1] Energy prices drove over 60% of the monthly increase, up 23.5% annually. Core CPI held at 2.9%. Heraeus precious metals analysts noted that the reading had “entrenched the market view of a higher-for-longer interest rate environment.”[4]
The CME FedWatch Tool as of 15 June showed around a 60% probability of at least one rate hike by the December FOMC.[5]
The Warsh FOMC: the dot plot matters more than the rate call
Kevin Warsh was sworn in as the 17th Federal Reserve Chair on 22 May 2026.[2] His first FOMC meeting on 16-17 June is expected to hold the benchmark rate at 3.50%-3.75%, with CME FedWatch pricing a 97.4% probability of no change.[5]
Market participants are expected to focus heavily on the updated dot plot and Chair Warsh’s remarks: specifically whether it adds a 2026 rate hike projection, and how Warsh frames the policy outlook in his first press conference. JPMorgan’s chief economist told Bloomberg an explicit hike signal looks unlikely but that Warsh may say he “can’t rule it out.”[6]
XAGUSD key levels
Reference levels from the chart. Not trade signals. Read this to find out more about support and resistance as the fundamental technical analysis in trading.
| Level | Type | Price (USD/oz) | Context |
| Resistance 2 | Resistance | 71.00 | Swing high, 14-15 June 2026 |
| Resistance 1 | Resistance | 70.00-70.80 | Prior rally zone; nearby 15-minute 200-period MA at 69.857 |
| Current price | Close | 69.36 | 05:44 UTC, 16 June 2026 (13:44 GMT+8) |
| Support 1 | Support | 68.00-68.50 | Pre-ceasefire base; 15-min 50-period MA at 69.045 |
| Support 2 | Support | 64.00-65.00 | Consolidation floor, 9-11 June 2026 |
Table 1: XAGUSD levels as of 16 June 2026, 05:44 UTC. Sources: TradingView, Vantage XAGUSD CFD. Indicative only.
What to watch
- FOMC decision, 17 June: Rate hold is priced. The dot plot update and Warsh’s 14:30 ET press conference are the key event for silver price positioning.
- Strait of Hormuz signing, 19 June: Formal ceasefire ceremony in Switzerland. Any disruption to the deal would reintroduce energy inflation risk.
- US dollar (DXY): Silver has historically moved inversely to DXY strength. A softer dollar response after the FOMC would likely extend the ceasefire tailwind for XAGUSD.
Risk management
Market participants often observe the $68.00-$68.50 area as a near-term reference zone, given its role as the pre-ceasefire consolidation base and the proximity of the 15-minute 50-period MA. The broader $64.00-$65.00 range served as the floor from 9 to 11 June.
Stop Loss placement around structural levels is a common element of managing exposure through scheduled event risk such as the FOMC announcement on 17 June, when rapid price dislocations across correlated positions can occur simultaneously.
Leverage amplifies both gains and losses, it is a double-edged tool. Reviewing position sizing relative to account equity ahead of the Warsh press conference on 17 June is worth considering. The RSI per the TradingView setup at 36.98 as of 05:44 UTC on 16 June 2026 reflects cooled momentum — a reading some market participants incorporate into their risk-per-trade calculations alongside account size.

RISK WARNING: CFDs are complex financial instruments and carry a high risk of losing money rapidly due to leverage. You should ensure you fully understand the risks involved and carefully consider whether you can afford to take the high risk of losing your money before trading.
Disclaimer: The information is provided for educational purposes only and doesn’t take into account your personal objectives, financial circumstances, or needs. It does not constitute investment advice. We encourage you to seek independent advice if necessary. The information has not been prepared in accordance with legal requirements designed to promote the independence of investment research. No representation or warranty is given as to the accuracy or completeness of any information contained within. This material may contain historical or past performance figures and should not be relied on. Furthermore estimates, forward-looking statements, and forecasts cannot be guaranteed. The information on this site and the products and services offered are not intended for distribution to any person in any country or jurisdiction where such distribution or use would be contrary to local law or regulation.
References
[1] “CPI inflation report May 2026: Prices rose 4.2% annually – CNBC” https://www.cnbc.com/2026/06/10/cpi-inflation-report-may-2026.html Accessed on 16 June 2026.
[2] “Kevin Warsh opens first Fed meeting June 16 with rate hold expected – FXStreet” https://www.fxstreet.com/analysis/kevin-warsh-opens-first-fed-meeting-june-16-with-rate-hold-expected-202606151326 Accessed on 16 June 2026.
[3] “Silver prices moving up following US, Iran ceasefire deal – Yahoo Finance” https://finance.yahoo.com/personal-finance/investing/article/silver-prices-today-monday-june-15-2026-silver-prices-moving-up-following-us-iran-ceasefire-deal-112535606.html Accessed on 16 June 2026.
[4] “Precious Metals Weekly: Gold and silver face headwinds from higher-for-longer rates after Iran ceasefire – Heraeus” https://www.heraeus.com/en/hpm/precious_metals_weekly/ Accessed on 16 June 2026.
[5] “CME FedWatch Tool — Fed Funds futures probabilities, June 2026 – CME Group” https://www.cmegroup.com/markets/interest-rates/cme-fedwatch-tool.html Accessed on 16 June 2026.
[6] “Kevin Warsh faces rate hike pressure at first FOMC meeting – Quartz” https://qz.com/kevin-warsh-fed-chair-rate-hikes-trump-bond-market-fomc-061526 Accessed on 16 June 2026.
[7] “Silver fell to 69.91 USD on June 16, 2026 – Trading Economics” https://tradingeconomics.com/commodity/silver Accessed on 16 June 2026.
[8] “Silver jumps toward $71 an ounce as US and Iran reach peace agreement – Reuters” https://www.reuters.com/markets/commodities/silver-gold-prices-june-2026/ Accessed on 16 June 2026.
