


[DAILY TRADING] MSFT Analysis 15 July 2026 – MSFT Stock Price Today Steadies Near $385 After Software Selloff

Vantage Editorial Team >
Vantage Editorial Team >
Vantage is a global, multi-asset broker with a team of in-house writers and market analysts who produce educational and insightful trading content for traders of all levels.
 Updated Wed, 2026 July 15 09:37
![[DAILY TRADING] MSFT Analysis 15 July 2026 – MSFT Stock Price Today Steadies Near $385 After Software Selloff](https://www.vantagemarkets.com/wp-content/uploads/2026/07/ChatGPT-Image-Jul-15-2026-05_35_02-PM.webp)
The MSFT stock price today reflects Microsoft (MSFT, Nasdaq: MSFT) still working through a sharp software-sector selloff. As of the cut-off for this analysis, 16:39 (GMT+8) / 04:39 (EDT) on 15 July 2026, the MSFT share price stands at $384.95 on the Vantage MSFT CFD, down $0.48 (-0.12%) from the prior 15-minute close, with an intraday range of $384.80 to $386.22 on volume of 190.25K for that candle.
Pre-market indicative pricing showed MSFT near $386.88, as the stock recovers from a slide that unfolded around 14 July 2026, coinciding with an earnings warning from IBM that resurfaced doubts about enterprise software demand.
MSFT stock price today: what the chart is showing
On the MSFT chart used for this analysis, the stock has spent the past month tracing a wide range. Price fell from around $380 in late June to a trough near $352 by 25 June, then recovered sharply into early July, climbing above $395 by 7 July. A pullback followed into 8-9 July before another push higher into a fresh multi-week peak above $396 around 13 July. The stock then reversed sharply, giving back several sessions of gains into the current level near $385.
The 50-period and 200-period moving averages sit at $386.41 and $388.32 respectively, both on the TradingView setup used for this analysis. The 50-period moving average has flattened after its early-July advance and now sits just below the 200-period moving average, a configuration that reflects the recent pullback rather than a sustained downtrend. MSFT is currently trading just below both.
The RSI (14, close) reads 40.53, with its moving-average overlay at 46.37, both figures per the TradingView setup used for this analysis. Both readings sit below the neutral 50 mark, consistent with the loss of upside momentum since the mid-July peak, though neither is deep enough into oversold territory to suggest an extended decline on its own. The increase in trading volume coincided with the recent decline, suggesting stronger market participation during the move.
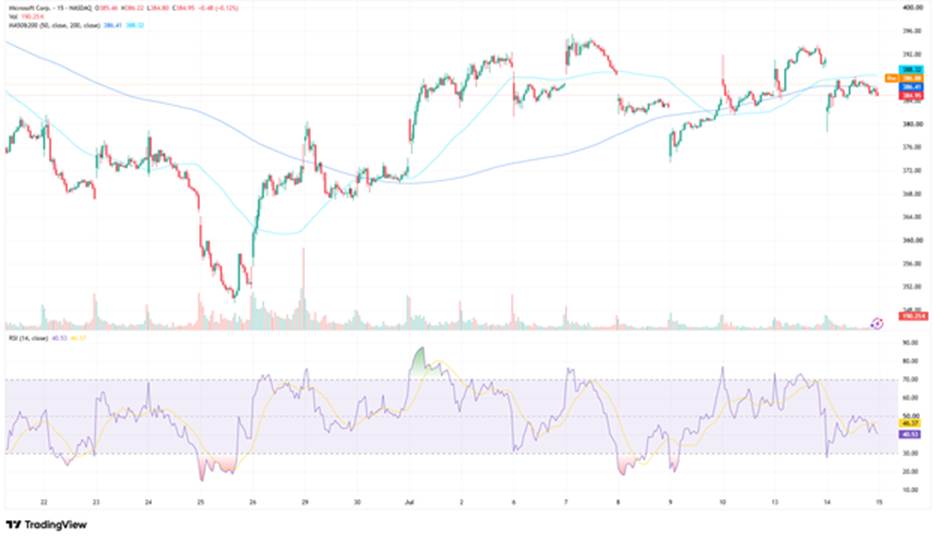
Figure 1: MSFT 15-Minute Chart (TradingView, https://www.tradingview.com/symbols/NASDAQ-MSFT/) Accessed on 15 July 2026. Data indicative, for informational purposes only.
Why MSFT stock news today is dominated by the software sector
The pullback traces back to 14 July 2026, when IBM issued a preliminary update ahead of its second-quarter results, due on 22 July 2026. IBM said clients had shifted spending toward servers, storage, and memory in the final weeks of June to secure AI infrastructure capacity, at the expense of software budgets. [1]
The update coincided with a decline of roughly a fifth to a quarter in IBM’s own share price on the day, and a broader selloff across enterprise software names, with Microsoft, ServiceNow, Salesforce, and Intuit among those affected. [1] The Nasdaq 100 as a whole held up better than the software names individually, suggesting the reaction was concentrated in the sector rather than the broader market. [1]
The reaction reflects a wider concern that has built for months: that heavy corporate spending on AI infrastructure could come at the expense of traditional software budgets. Reports suggested Starbucks was expanding certain in-house AI capabilities, adding to broader investor concerns about enterprise software demand. [2]
Separately, Microsoft has also trimmed roles within its Xbox division this year as part of ongoing cost discipline, even as the company continues to expand AI-related infrastructure spending. [3] None of this changes Microsoft’s own guidance, which remains unconfirmed until its fiscal fourth-quarter results land on 29 July 2026. Read the latest stock market news here.

MSFT stock forecast: what to watch, not what to predict
For anyone searching for an MSFT stock forecast or MSFT stock prediction today, the more useful frame is a calendar, not a call. IBM’s full second-quarter report on 22 July 2026 will show whether the spending shift it flagged was a one-quarter phenomenon or something more structural for the software sector as a whole. [1]
Microsoft then reports its own fiscal year 2026 fourth-quarter results after the market close on 29 July 2026, confirmed directly by the company. [4] Markets are pricing continued scrutiny of enterprise software spending into both dates, and whether Microsoft’s own commentary on Azure and Copilot demand can offset the sector-wide caution may only become clear once management addresses it directly on the call.
Levels to watch for the MSFT share price
The table below covers the zone traders are watching for the MSFT share price. These are reference levels, not trade signals.
| Pair | Support | Resistance | What’s happening |
| MSFT | $376.00 | $392.00 / $396.00 | Near $384.95, consolidating below the 50-period and 200-period moving averages |
Table 1: Key levels as of 15 July 2026, based on the TradingView setup used for this analysis. Indicative only.
Given the sharp single-session move seen on 14 July 2026, standard intraday range assumptions may be less reliable around IBM’s 22 July report and Microsoft’s own 29 July 2026 earnings. Stop Loss placement around the $376.00 support and $392.00-$396.00 resistance zone is one of the levels traders often monitor, without any suggestion this removes the risk of a larger move on the day.
Leverage works both ways in this kind of event-driven, headline-sensitive environment ahead of two closely watched earnings dates. Position sizing relative to account equity is worth revisiting for anyone holding exposure to MSFT or related software-sector CFDs into 22 and 29 July.

RISK WARNING: CFDs are complex financial instruments and carry a high risk of losing money rapidly due to leverage. You should ensure you fully understand the risks involved and carefully consider whether you can afford to take the high risk of losing your money before trading.
Disclaimer: The information is provided for educational purposes only and doesn’t take into account your personal objectives, financial circumstances, or needs. It does not constitute investment advice. We encourage you to seek independent advice if necessary. The information has not been prepared in accordance with legal requirements designed to promote the independence of investment research. No representation or warranty is given as to the accuracy or completeness of any information contained within. This material may contain historical or past performance figures and should not be relied on. Furthermore estimates, forward-looking statements, and forecasts cannot be guaranteed. The information on this site and the products and services offered are not intended for distribution to any person in any country or jurisdiction where such distribution or use would be contrary to local law or regulation.
References
[1] “IBM warns AI boom is squeezing software budgets; shares slump in sector rout – Reuters via MarketScreener” https://www.marketscreener.com/news/ibm-warns-ai-boom-is-squeezing-software-budgets-shares-slump-in-sector-rout-ce7f5edcd18ef427 Accessed on 15 July 2026.
[2] “Why Are Microsoft and IBM Stocks Falling in Pre-Market Trading Today, 7/9/26? – TipRanks” https://www.tipranks.com/news/why-are-microsoft-and-ibm-stocks-falling-in-pre-market-trading-today-7-9-26 Accessed on 15 July 2026.
[3] “How Investors Are Reacting To Microsoft (MSFT) Amid AI Spending Jitters And Job Cuts News – Simply Wall St via Yahoo Finance” https://finance.yahoo.com/markets/stocks/articles/investors-reacting-microsoft-msft-amid-181543565.html Accessed on 15 July 2026.
[4] “Microsoft announces quarterly earnings release date – Microsoft News Source” https://news.microsoft.com/source/2026/07/08/microsoft-announces-quarterly-earnings-release-date-68/ Accessed on 15 July 2026.
[5] “Software stocks slide on enterprise spending concerns: Microsoft drops 3% – XTB Market Analysis” https://www.xtb.com/int/market-analysis/news-and-research/software-stocks-slide-on-enterprise-spending-concerns-microsoft-drops-3 Accessed on 15 July 2026.
