[DAILY TRADING] AUDUSD Analysis 4 June 2026 — 0.7125 After GDP Shock and RBA Pause Bets
Vantage Editorial Team >
Vantage Editorial Team >
Vantage is a global, multi-asset broker with a team of in-house writers and market analysts who produce educational and insightful trading content for traders of all levels.
![[DAILY TRADING] AUDUSD Analysis 4 June 2026 — 0.7125 After GDP Shock and RBA Pause Bets](https://www.vantagemarkets.com/wp-content/uploads/2026/06/AUDUSD_hero.webp)
The Vantage AUDUSD CFD was sitting near 0.71258 as at 10:43 (GMT+8) on 4 June 2026. The pair touched 0.71390 earlier in the Asian session, then gave it all back. The reason is pretty straightforward: Australia just posted its weakest GDP quarter in a year, and the market read it as the clearest signal yet that the Reserve Bank of Australia (RBA) is done hiking.
Q1 2026 Gross Domestic Product (GDP) grew 0.3% quarter-on-quarter, well short of the 0.5% expected and half the pace of the previous quarter. Exports fell, government spending retreated, and a surge in data centre imports ballooned the trade deficit. The AUD dropped on the print, and it has struggled to recover since, with ongoing geopolitical uncertainty from the Middle East adding intermittent support for the USD.
All prices are from the Vantage AUDUSD CFD as at 10:43 (GMT+8), 4 June 2026. Charts are indicative and from TradingView. This is not financial advice.
Key Points
- AUDUSD was near 0.71258 as at 10:43 (GMT+8) on 4 June 2026, pulling back from an intraday high of 0.71390 on the 1-minute chart.
- Australia’s Q1 2026 GDP came in at 0.3% QoQ, a weaker-than-expected quarterly reading, reinforcing market expectations that the RBA may leave rates unchanged at the 16 June meeting.
- The AUDUSD trend remains above the 100-day EMA near 0.7038 per the author’s TradingView setup, but the GDP miss and a firmer USD are capping the pair’s near-term recovery.
What the chart is showing
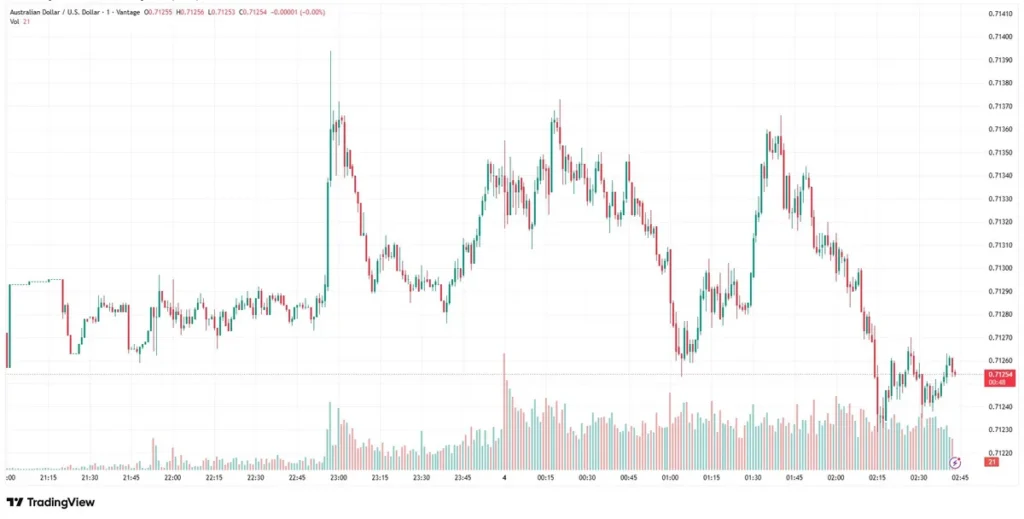
The 1-minute Vantage AUDUSD CFD chart covers the late 3 June session through 02:43 (UTC) on 4 June 2026. The pair spent most of the evening in a tight sideways grind around 0.71280–0.71310 before spiking hard to 0.71390 just before midnight UTC. It looked like a breakout. It wasn’t.
The spike was retraced within a handful of candles. Two more attempts into the 0.71360–0.71380 area followed, both turned back. By about 01:30 (UTC), the pattern was clear: lower highs, and each rally running out of steam a little earlier than the last. Volume on the Vantage CFD feed picked up noticeably between 02:00 and 02:30 (UTC) as the pair slid toward 0.71220–0.71240.
The RSI on the TradingView setup used for this analysis stayed neutral throughout, not oversold, not building any real momentum in either direction. That matches the broader picture: a pair under quiet but consistent pressure, not one in freefall.
The three things driving AUDUSD right now
The GDP miss and what it means for the RBA
Australia’s Q1 2026 GDP rose 0.3% QoQ, per the Australian Bureau of Statistics (ABS) on 3 June 2026[1], missing the 0.5% consensus. Net trade subtracted 0.8 percentage points as coal and iron ore exports fell while imports rose sharply, partly driven by data centre investment. Government spending dropped 0.2%, its softest reading since Q3 2022.
The RBA has already hiked three times this year, lifting the cash rate to 4.35%.[2] That’s a lot of tightening in a short time. Thursday’s miss doesn’t make the case for another hike any easier. Capital Economics noted the data would likely keep the RBA in ‘wait and watch’ mode near term, though a further 25 basis-point hike in August remains on the table if inflation picks back up.[3]
The USD safe-haven bid & Middle East tensions persist
Ongoing geopolitical uncertainty from the Middle East conflict has been providing intermittent support for the USD, with risk sentiment keeping AUD on the defensive as a risk-sensitive currency.[4] It is not a dramatic flight-to-safety move, more a persistent background pressure. Australian inflation was running at 4.09% annually in Q1 2026, above the RBA’s target band, and the same energy-cost pressures behind that number are also squeezing household spending. That is part of what dragged on the GDP print.
The rate differential is still the Aussie’s structural support
The RBA’s 4.35% cash rate is one of the highest in the G10 group, and it is the main reason AUDUSD has come as far as it has.[2] Back in early 2026 the pair was trading in the 0.63–0.66 range. A combination of USD softness and a hawkish RBA pushed it to multi-year highs above 0.72. That structural support has not gone away. But the GDP miss raises a real question: if the RBA is now done, and the Fed stays higher for longer, the rate advantage slowly narrows. That is the tension the pair is sitting in right now.
Levels to watch
The table below covers the zones traders are watching on the Vantage AUDUSD CFD. These are reference levels, not trade signals.
| Pair | Support | Resistance | What’s happening |
| AUDUSD | 0.7120 | 0.7175 / 0.7180 | Near 0.7125 at cut-off; faded after GDP miss |
Table 1: Key AUDUSD levels as at 10:43 (GMT+8), 4 June 2026. Sources: Vantage AUDUSD CFD, TradingView, Trading Economics. Indicative only.
What to watch this week and beyond
These are the events most likely to move the AUDUSD rate from here:
- RBA Meeting, 16 June: Markets have largely priced in a hold at this meeting. The real read will be the tone of the statement: specifically whether the board signals it is genuinely done or keeping August alive.
- Australia CPI Q2 (July): The next quarterly inflation print is the one that matters most for the second-half RBA outlook. A re-acceleration reopens the hiking debate; further cooling takes the pressure off AUD.
- Middle East Developments (ongoing): Any credible shift toward de-escalation could ease the intermittent USD bid and reduce a headwind for AUD. Further escalation runs the other way.
- China demand data (ongoing): Australia exports a lot of iron ore to China. Weak manufacturing or infrastructure data there tends to show up in AUD before most other indicators.
On risk management: AUDUSD has been moving fast on data releases and geopolitical headlines. Market participants continue to monitor risk-management approaches around key support and resistance zones. Combined exposure across correlated pairs is worth checking; in a sharp risk-off move, they can all gap in the same direction at once. Stop Loss sizing relative to account equity is part of that calculation.
Leverage works both ways in the Vantage AUDUSD CFD: gains and losses scale equally. Position sizing relative to your account is worth revisiting ahead of the 16 June RBA meeting.
RISK WARNING: CFDs are complex financial instruments and carry a high risk of losing money rapidly due to leverage. You should ensure you fully understand the risks involved and carefully consider whether you can afford to take the high risk of losing your money before trading.
Disclaimer: The information is provided for educational purposes only and doesn’t take into account your personal objectives, financial circumstances, or needs. It does not constitute investment advice. We encourage you to seek independent advice if necessary. The information has not been prepared in accordance with legal requirements designed to promote the independence of investment research. No representation or warranty is given as to the accuracy or completeness of any information contained within. This material may contain historical or past performance figures and should not be relied on. Furthermore estimates, forward-looking statements, and forecasts cannot be guaranteed. The information on this site and the products and services offered are not intended for distribution to any person in any country or jurisdiction where such distribution or use would be contrary to local law or regulation.
References
[1] “Australian National Accounts: National Income, Expenditure and Product, March 2026 — Australian Bureau of Statistics” https://www.abs.gov.au/statistics/economy/national-accounts/australian-national-accounts-national-income-expenditure-and-product/latest-release Accessed on 4 June 2026.
[2] “Australia hikes rates again and warns inflation will stay higher for longer — CNBC” https://www.cnbc.com/2026/05/05/australia-central-bank-rate-hike-inflation-rba.html Accessed on 4 June 2026.
[3] “Australia Q1 GDP grows less than expected amid inflation, M.East headwinds — Investing.com” https://in.investing.com/news/economic-indicators/australia-q1-gdp-grows-less-than-expected-amid-inflation-meast-headwinds-5437864 Accessed on 4 June 2026.
[4] “Australian dollar — Trading Economics” https://tradingeconomics.com/australia/currency Accessed on 4 June 2026.
[5] “Australia Q1 GDP misses expectations: What 0.3% growth means for AUD/USD — FXStreet” https://www.fxstreet.com/news/australia-gdp-misses-expectations-what-03-growth-means-for-aud-usd-202606030132 Accessed on 4 June 2026.
