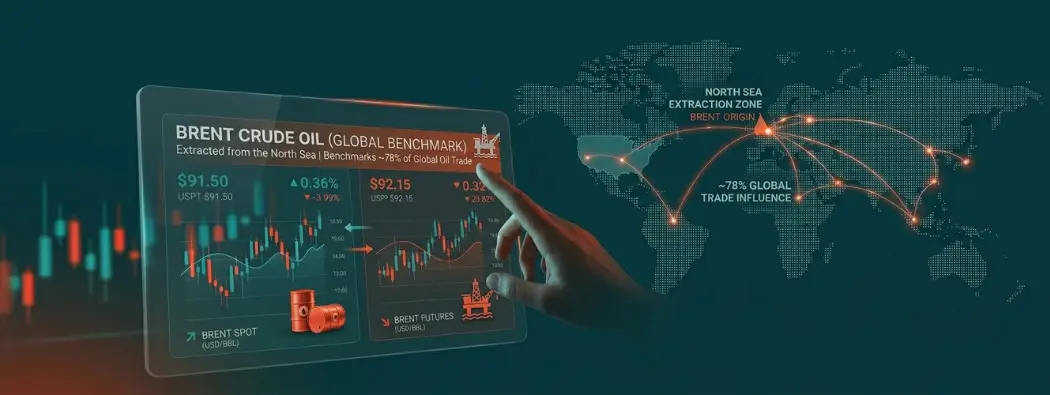
Brent crude oil is more than just a commodity. It is the world’s most important oil pricing benchmark — the reference point used to price approximately 78% of globally traded physical crude oil, set energy policy, and guide investment decisions across every continent.
For Australian traders, Brent is the single most directly relevant crude oil benchmark. It prices Australia’s oil imports, underpins the revenues of ASX-listed energy companies like Woodside and Santos, and reacts to the same Asia-Pacific demand cycles that shape the broader Australian economic outlook.
This guide covers what Brent crude is, what moves its price, how to analyse it, and how to approach trading it — including the significant risks involved.
Key Points
• Brent crude is extracted from the North Sea and benchmarks ~78% of global oil trade.
• It is the most relevant oil benchmark for Australian traders, pricing local imports and ASX energy revenues.
• Prices are driven by supply and demand, OPEC decisions, macroeconomic conditions, and geopolitical events — all of which are inherently unpredictable.
• Brent can be traded via CFDs, the BetaShares OOO ETF (ASX), or ASX energy stocks.
• ASIC caps commodity CFD leverage at 10:1 for Australian retail clients.
• All trading involves risk. You may lose all of your invested capital.
What Is Brent Crude Oil?
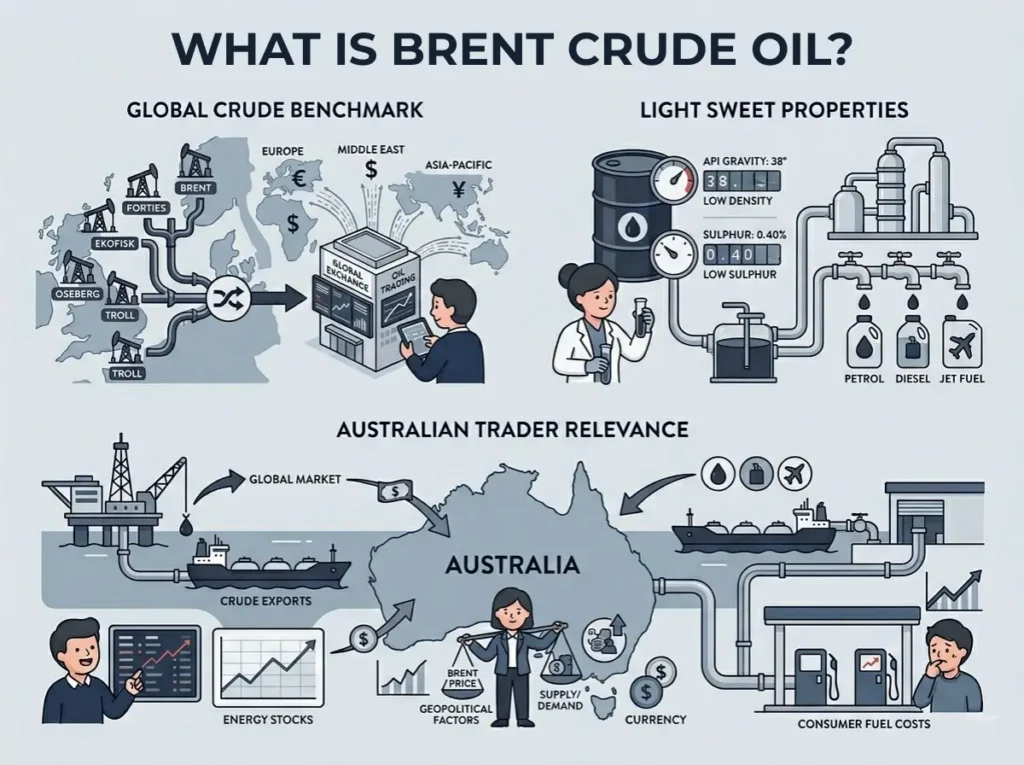
Brent crude refers to a blend of light, sweet crude oils extracted from multiple fields in the North Sea — including Brent, Ekofisk, Forties, Oseberg, and Troll. It is traded on the Intercontinental Exchange (ICE) and forms the basis for pricing crude oil across Europe, Africa, the Middle East, and the Asia-Pacific.
Brent is classified as ‘light’ (low density, API gravity of 38°) and ‘sweet’ (low sulphur content of 0.40%). These properties make it relatively straightforward to refine into petrol, diesel, and jet fuel.
Relevant for Australian Traders
Australia’s dual energy position: Australia is simultaneously a significant energy exporter and an importer of refined petroleum products. Companies like Woodside Energy sell production into global markets priced off Brent, while Australia imports nearly all of its refined fuel at Brent-referenced prices. This means Brent price movements can affect Australian energy stocks and consumer fuel costs simultaneously, though the relationship is not linear and other factors influence both.
▶ Vantage Video: Crude Oil — WTI vs Brent
For a concise visual introduction to Brent crude and how it compares to WTI, watch this short explainer from Vantage covering benchmark properties, pricing factors, and the main ways to gain market exposure.
Watch on YouTube: https://www.youtube.com/watch?v=LgO6jUlqhKo
A Brief History of Brent Crude
The Brent benchmark traces its origins to the North Sea oil boom following the UN’s 1964 Convention on the Continental Shelf. Key milestones:
• 1969: Phillips Petroleum strikes oil in the Ekofisk field — the first major North Sea find.
• 1971: The Brent field is discovered, followed by Ninian, Oseberg, and other major sites.
• 1980s–1990s: Brent Blend becomes the dominant global benchmark as production scales up.
• Early 2000s: Original fields begin to deplete; the benchmark expands to include additional North Sea crudes (the BFOET basket).
• 2017: The original Brent oil field is officially decommissioned — the benchmark continues under the expanded BFOET definition.
What Drives Brent Crude Oil Prices?
Supply and demand
The most fundamental driver. When global demand grows faster than supply can accommodate — as happened between 2004 and 2008 — prices rise. When supply floods the market or demand collapses unexpectedly — as in the COVID-19 pandemic of 2020 — prices can fall sharply and rapidly. These dynamics are difficult to predict, and positioning in advance, carries substantial risk.
Because most Brent crude trading occurs in futures markets rather than the physical spot market, market sentiment and expectations can amplify price moves well beyond what the underlying supply-demand balance alone would justify.
OPEC+ production decisions
OPEC+ — which includes OPEC’s 13 member nations plus Russia and other producers — controls roughly 40% of global oil output. The group regularly adjusts production quotas. A production cut typically pushes prices higher; an increase in output puts downward pressure on prices. However, market reactions to OPEC decisions can be unpredictable and do not always follow the expected direction.
Macroeconomic conditions
Oil demand is deeply tied to global economic activity. Recessions and sharp slowdowns can destroy demand almost overnight, leading to swift and significant price declines that can result in large losses for leveraged traders.
Relevant for Australian Traders
For Australian traders, Chinese economic data is a particularly important signal for Brent crude. China is the world’s largest crude oil importer, with imports predominantly priced against Brent. Chinese manufacturing PMI, industrial output, and infrastructure spending announcements can affect Brent prices. However, the relationship between economic data and oil prices is not deterministic, and past patterns are not a reliable guide to future price movements.
Geopolitical events
Brent crude is highly exposed to international geopolitical risk, including conflicts, sanctions, and threats to shipping routes such as the Strait of Hormuz or the Suez Canal. Geopolitical events are inherently unpredictable and can cause rapid, sharp price movements in either direction, creating significant risk for leveraged positions.
Historical Price Patterns
The following historical examples are provided for educational context only. Past price behaviour does not predict future outcomes.
2004–2008: The supercycle
Strong demand from China and emerging markets, combined with supply disruptions, drove Brent from under USD 30 to nearly USD 100 per barrel. The 2008 financial crisis then caused demand to evaporate — prices collapsed by nearly 40% in months, causing severe losses for long-positioned traders.
2014–2016: The shale shock
The US shale revolution flooded global markets with new supply. OPEC chose to defend market share rather than cut production. Brent fell from above USD 100 to below USD 30 per barrel — a collapse that wiped out many long positions and demonstrated how quickly market fundamentals can shift.
2020–2022: Pandemic and recovery
COVID-19 lockdowns drove prices to historic lows in 2020. The recovery — faster than many anticipated — combined with the Russia-Ukraine war, drove Brent above USD 100 per barrel in 2022. This episode illustrates that oil markets can move sharply in both directions over a short period.
How to Trade Brent Crude Oil
There are several ways to gain exposure to Brent crude oil price movements, each with different risk profiles and suitability for different types of traders and investors. None of these instruments guarantees returns, and all carry the risk of loss.
1. Brent Crude Oil CFDs
CFDs allow you to trade directly on Brent crude price movements — long or short — without owning the physical commodity. You trade on margin, which amplifies both gains and losses. On the Vantage platform, Brent CFDs are available via:
• UKOUSD — Brent Crude Oil Cash (spot price)
• UKOUSDft — Brent Crude Oil Futures (futures-referenced price)
ASIC Regulation — Australian Traders
In Australia, ASIC caps commodity CFD leverage at 10:1 for retail traders. A $1,000 margin deposit controls a $10,000 Brent crude CFD position — but losses are also calculated on the full $10,000 position value. ASIC also mandates negative balance protection: you cannot lose more than the funds in your account. These rules have been in force since 29 March 2021.
2. ASX-listed ETF
The BetaShares Crude Oil Index ETF (ASX: OOO) is Australia’s only ASX-listed crude oil ETF. It tracks crude oil futures performance and is AUD-hedged, which reduces (but does not eliminate) AUD/USD currency risk.
Important: OOO is a futures-based ETF. During periods when longer-dated futures are priced higher than near-term ones (contango), the ETF can experience roll costs that cause it to underperform the spot oil price — potentially by 5–10% annually. OOO is not suited to long-term buy-and-hold strategies for this reason. ETF returns are not guaranteed and can be negative.
3. ASX Energy Stocks
ASX-listed energy companies provide indirect exposure to Brent crude through equity markets. Company-specific factors (production guidance, capital expenditure, management decisions) also significantly affect share prices, independently of oil price movements.
• Woodside Energy (ASX: WDS) — Australia’s largest independent oil and gas producer
• Santos (ASX: STO) — major oil and LNG producer; more diversified than Woodside
• Beach Energy (ASX: BPT) — smaller producer; higher sensitivity to oil price movements and correspondingly higher risk
Past performance is not a reliable indicator of future results. Dividend yields and returns referenced are historical and not guaranteed.
How to Analyse Brent Crude
Fundamental Analysis
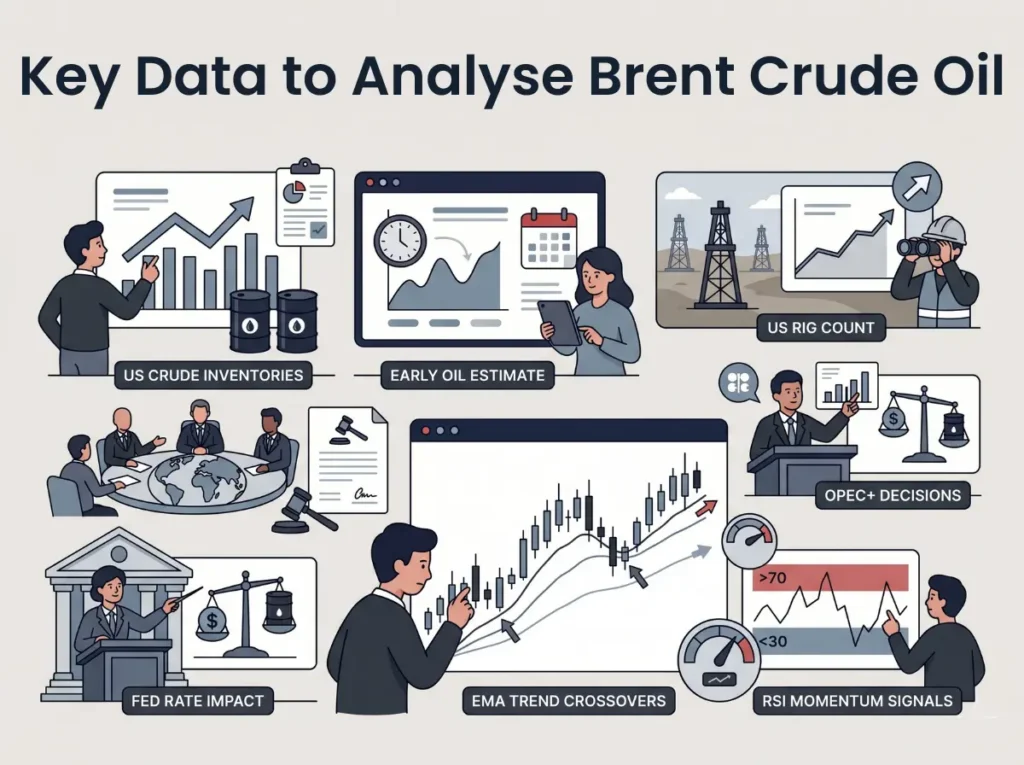
Fundamental analysis involves tracking the real-world forces that drive supply and demand. The following data sources and events are commonly monitored by oil traders. Monitoring these sources does not guarantee accurate market predictions.
• OPEC+ monthly oil market report and production meeting outcomes
• IEA (International Energy Agency) Oil Market Report — monthly global supply and demand forecasts
• Chinese manufacturing PMI and industrial output data
• US EIA weekly petroleum inventory report (affects broader oil sentiment)
• Geopolitical developments in the Middle East, North Africa, and Russia
Historical context:
In October 2023, following the Hamas attack on Israel, Brent crude rose approximately 5.5% within two trading days as markets priced in the risk of broader regional conflict. This is a historical example of how geopolitical events can cause rapid price moves — it is not a predictive framework, and future geopolitical events may produce different market reactions.
Technical Analysis
The 3EMA (Triple Exponential Moving Average)
Moving averages smooth out daily price noise to help identify broader trends. The 3EMA uses three timeframes simultaneously — fast (e.g., 20-day), medium (e.g., 50-day), and slow (e.g., 200-day). Technical analysis does not guarantee accurate forecasts; it is a tool to support decision-making, not a predictor of future outcomes.
- Bullish crossover signal: A shorter EMA crosses above a longer one, suggesting upward momentum may be building.
- Bearish crossover signal: A shorter EMA crosses below a longer one, suggesting downward momentum may be developing.
The RSI (Relative Strength Index)
The RSI is a momentum oscillator ranging from 0 to 100 that signals potential overbought (above 70) or oversold (below 30) conditions. It is a lagging indicator and its signals can fail, particularly in strongly trending markets.
• Above 70: Potentially overbought — price may be vulnerable to a pullback
• Below 30: Potentially oversold — price may be due for a bounce
Using RSI in conjunction with the 3EMA can provide additional context for trading decisions. Neither indicator guarantees profitable trades.
Risk Management for Brent Crude Traders
Brent crude is highly volatile and can be affected by sudden, unpredictable geopolitical shocks. A disciplined risk management framework is essential and does not eliminate the risk of loss.
• Risk no more than 1–2% of your total trading capital on a single position
• Set stop-loss orders before entering every trade — never trade without a defined exit point
• Be cautious with leverage: even at ASIC’s 10:1 cap, a 10% adverse price move would eliminate the full margin deposit
• Consider reducing position size or closing trades ahead of high-impact events (OPEC meetings, major economic data releases)
• Use take-profit orders to lock in gains — avoid holding indefinitely in anticipation of further gains
Brent Crude CFD Trading Hours
| Instrument | Symbol | Trading Hours (GMT+2) |
| Brent Crude Oil Cash | UKOUSD | Monday: 01:00–24:00 | Tue–Fri: 03:00–24:00 |
| Brent Crude Oil Futures | UKOUSDft | Monday: 01:00–24:00 | Tue–Fri: 00:00–01:00 & 03:00–24:00 |
For AEST reference: GMT+2 01:00 is approximately 10:00–11:00 AEST (depending on daylight saving).
Conclusion
There is no single best way to trade Brent crude oil. The right approach depends on your goals, experience level, and how comfortable you are with the risks of a market that can move sharply and without warning — driven by forces as unpredictable as geopolitical conflict, OPEC decisions, and sudden shifts in global demand.
Brent’s status as the world’s dominant oil benchmark makes it particularly relevant for Australian traders — whether you are tracking its impact on ASX energy stocks, monitoring Asia-Pacific demand signals, or seeking direct exposure through CFDs. But that same global connectivity means Brent can react to events far outside any trader’s ability to anticipate or control.
If, after reading this guide, you feel Brent crude oil CFDs may suit your trading approach, you can explore CFD trading in more detail, practise first with demo trading, or open a live account when you are ready.
Frequently Asked Questions
Why is Brent crude the global benchmark?
Brent’s coastal North Sea origin provides logistical accessibility by sea tanker to global markets. Combined with its light, sweet qualities that make it cost-efficient to refine, it became the natural reference point for international oil trade from the 1980s onwards.
Is Brent more expensive than WTI?
Brent has historically traded at a modest premium to WTI. However, this relationship is not fixed and has inverted in the past. Past price relationships are not a guarantee of future pricing.
How does Brent crude affect petrol prices in Australia?
Australian petrol prices are influenced by Brent crude pricing, the AUD/USD exchange rate, and domestic refinery and retail margins. Rising Brent prices and/or a weakening AUD can increase fuel costs for Australian consumers and businesses.
What is the difference between Brent spot and Brent futures CFDs?
A spot CFD (UKOUSD) reflects the current market price of Brent crude. A futures CFD (UKOUSDft) is referenced against a futures delivery contract. Futures CFDs are more complex and carry additional risks related to futures pricing dynamics. They are generally more suitable for experienced traders.