
 Register
 Login
Login Register


When beginner traders view the different forex charts, it could seem intimidating. However, each chart aims to provide traders with convenience, rather than confusion. For traders to identify potential trade opportunities, it’s essential to understand the construction of forex charts and the distinct types of forex charts available to choose from.
Different Types of Forex Charts
There are three types of forex charts that every trader must know which are line charts, bar charts, and candlestick charts.
#1 Line Charts
Line charts are one of the most basic and simple price representations which connects the closing price of an instrument with a continuous line. The simplicity of the line chart allows for the elimination of ‘market noise’, which makes trading the trend much easier [1].
The line chart is especially useful for beginner traders as it teaches the basic skills of chart reading before advancing to other chart types such as bar or candlestick charts. Even technical indicators such as moving averages are presented using a line chart.
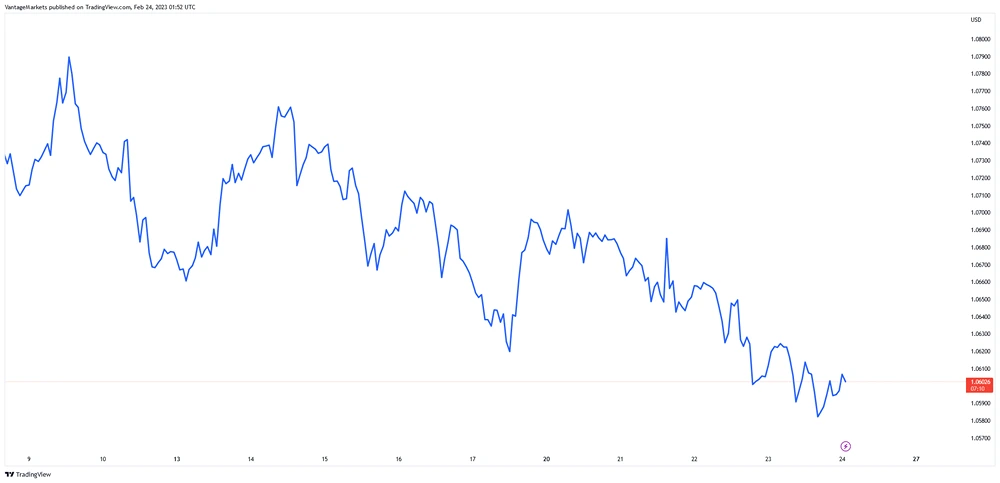
Figure 1 – Line Chart (https://www.tradingview.com/x/qW8hysc7/)
#2 Bar Charts
Compared to the line chart, the bar chart provides more information regarding the markets. Each bar consists of four key components: open, close, high, and low. The open and close represents the opening and closing price of a specific time frame, while the high and low represents the highest and lowest price the instrument went in a specific timeframe.
The additional detail provided by a bar chart allows traders to conduct a more detailed technical analysis. For example, details such as the highs and lows of an individual bar allows traders to determine the range the financial instrument is trading in.
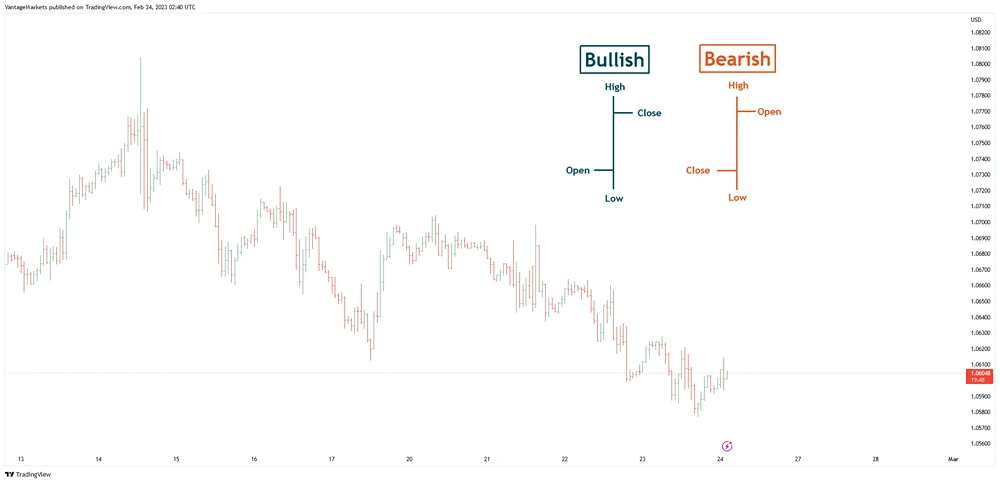
Figure 2 – Bar Chart (https://www.tradingview.com/x/vBEbwyjB/)
Candlestick Charts
Candlestick charts are like bar charts, with the anatomy of a candlestick consisting of an open, close, high, and low. The thicker bodies and colour coding of candlesticks make it much more popular compared to the bar chart, which is generally better at showcasing the open and the close of an instrument [2].
The area between the open and close is known as the candle body, while the high and low of the candlestick is called the candle wick. Another notable characteristic is the colour of the candlestick, intuitively, green equates to a bullish candlestick while a bearish candlestick is red (orange).
Traders often use candlestick charts to conduct technical analyses such as candlestick patterns. A singular candlestick provides a wealth of information, and a group of candlesticks form critical patterns that traders use to make market decisions.
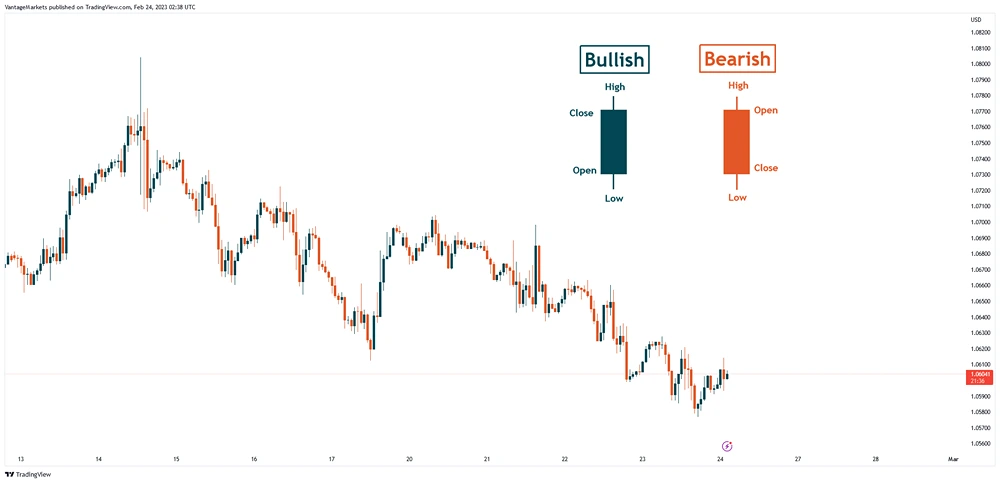
Figure 3 – Candlestick Chart (https://www.tradingview.com/x/vsvBYvnz/)
Which forex chart should you be using?
Understanding how the price of a currency pair changes over time through different graphical representations is a critical skill for traders to interpret raw price action and identify potential trading opportunities. All three types of chart each carry varying characteristics, while it depends on personal preference, traders can always pick the chart that best suits their specific trading strategies.
Looking to view the financial markets through the different chart types? Open a demo account here. The above images are used for illustrative purposes only.
References
- “Axiory Global Ltd. (n.d.). What are the Forex charts? – Different chart types explained – Axiory”. https://www.axiory.com/trading-resources/trading-terms/what-are-forex-charts . Accessed 2 March 2023.
- “Understanding a Candlestick Chart – Investopedia”. https://www.investopedia.com/trading/candlestick-charting-what-is-it/ . Accessed 8 April 2022.


