
 Register
 Login
Login Register



When it comes to analysing the forex market, top-down analysis is an approach often employed by experienced traders. This method involves viewing the financial instrument from a macro perspective before drilling down to specific trades.
In this article, we will explore top-down analysis in forex trading, and how it can be used to make informed trading decisions.
What is Top-Down Analysis?
Top-down analysis is an approach to analysing the market that begins by looking at the big picture, before narrowing it down to specific trades.
The first step in top-down analysis is to identify the major trends in the market. This can be done by analysing long-term charts, such as weekly or daily charts, and identifying key support and resistance levels.
Once the major trends have been identified, traders can then move down to the shorter-term charts, such as four- or one-hour charts, to look for potential entry and exit points. By analysing the market in this way, traders can get a better sense of the overall direction of the market and make more informed trading decisions.
| Trend Identification | Potential Entry & Exit |
| Weekly, Daily, H12 | H4, H1, M30 |
Table 1 – Usage of Different Time Frames Guide
The Importance of Top-Down Analysis
1. See through short-term noise
Top-down analysis can help traders to avoid getting caught up in short-term fluctuations in the market. By focusing on the bigger picture, traders can avoid making impulsive decisions based on short-term price movements.
2. Identification of strong, credible supports and resistances
Higher time frames allow traders to identify key support and resistance levels. By using these levels, traders now have concrete stop loss and take profit levels, which limits their risk exposure.
3. Spotting potential trade opportunities
Traders sometimes make the mistake of focusing excessively on the lower time frames, missing out on the opportunities on the higher time frames. Through proper use of the top-down analysis approach, traders can have the flexibility to capitalise on both long- and short-term trades.
Top-Down Analysis Case Study: GBPJPY
For this segment, we will be using GBPJPY as an example on how to conduct top-down analysis.
In figure 1, it showcases GBPJPY market between May 2022 to June 2022, when the Bank of England (BoE) raised interest rates for the first time in decades [1], while Bank of Japan (BoJ) maintained interest rates in the negatives [2].
GBPJPY rose over 1300 pips from a weekly point of view as show in figure 1. The bullish move can be credited to the interest rate differentials between both major economies. As the BoE raises interest rates, the Pound rises in value. As compared to BoJ’s dovish approach of keeping interest rates negative, which keeps the Yen weak.
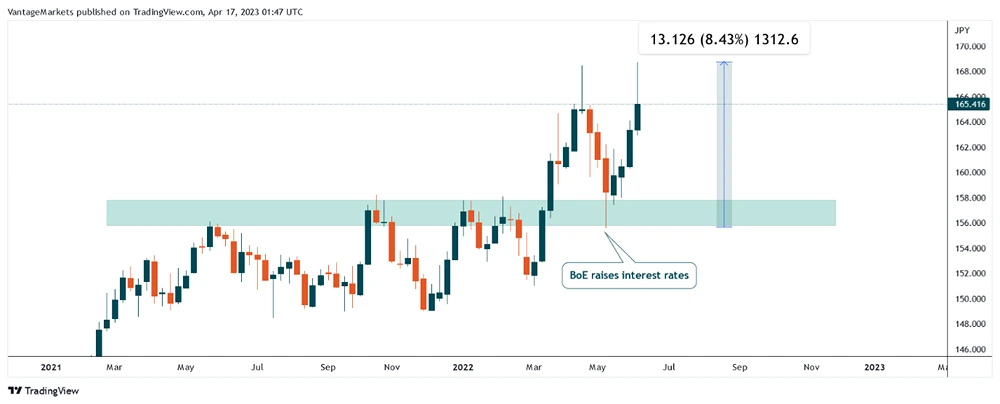
Figure 1 – GBPJPY Weekly Chart (https://www.tradingview.com/x/6QiFLplS/)
In figure 2, knowing that GBPJPY is bullish fundamentally, support and resistance levels can be plotted accordingly.
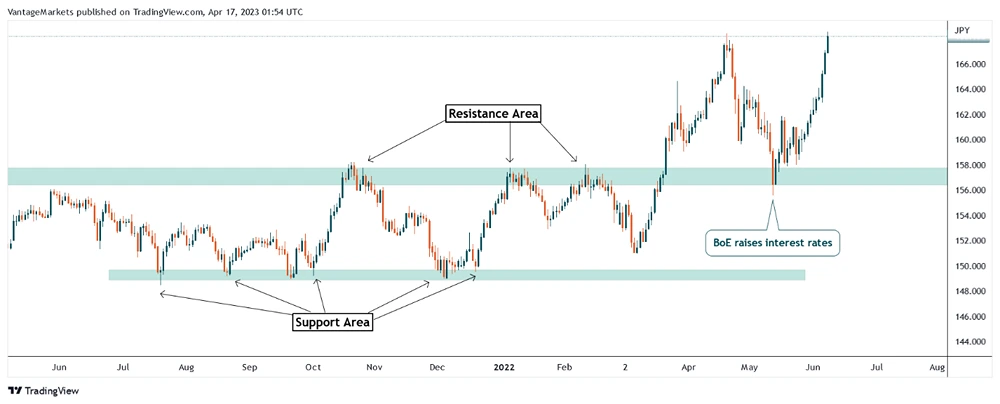
Figure 2 – GBPJPY Daily Chart (https://www.tradingview.com/x/IEbJWLBy/)
Figure 3 showcases the market structure near GBPJPY’s higher time frame resistance area. More specifically, GBPJPY breaking previous resistance and using it as a support.
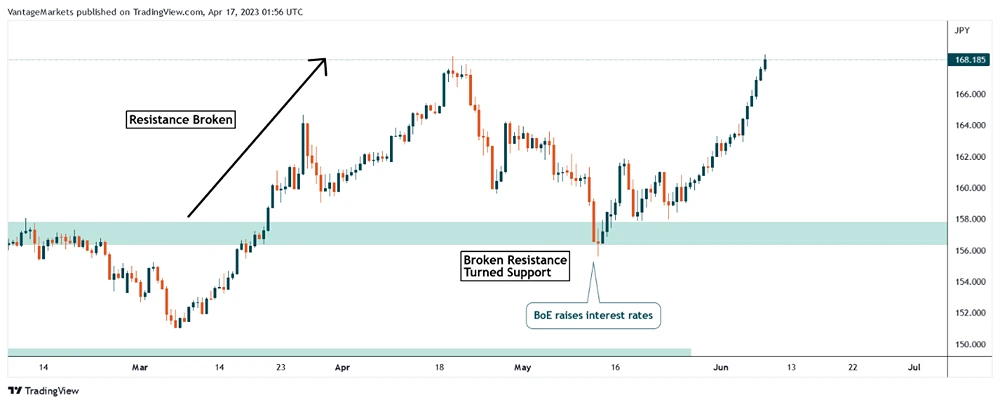
Figure 3 – GBPJPY H12 Chart (https://www.tradingview.com/x/noFn3qHU/)
Figure 4 shows bullish technical evidence of a double bottom formation at previous higher timeframe resistance. After completion of the bullish pattern, a buy trade can be entered.
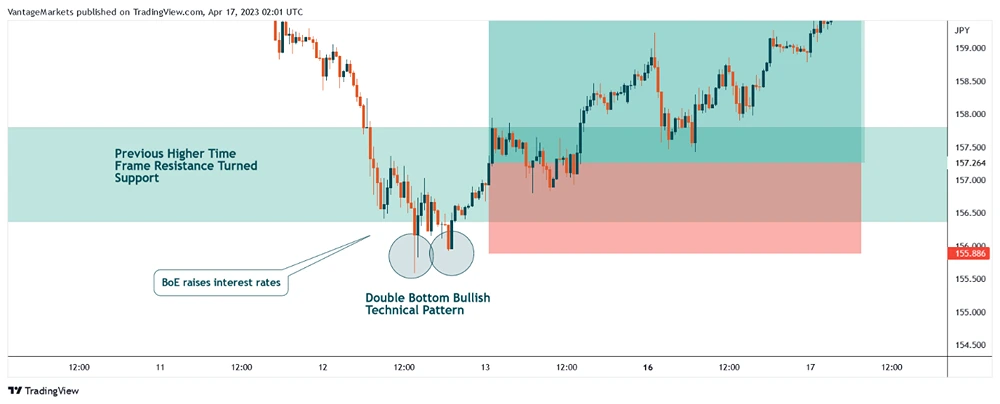
Figure 4 – GBPJPY M30 (https://www.tradingview.com/x/rS22Wq3Y/)
Conclusion
In conclusion, top-down analysis can be an essential tool for forex traders. By starting with the big picture and working down to the specific currency pair and timeframe, traders can potentially gain a better understanding of the market and identify trade opportunities.
It is encouraged to keep an eye on the news and events that can impact the market, and always use proper risk management techniques to protect your capital. With consistent practice and application of top-down analysis, traders could develop trading strategies that work in their favor. Want to practise top-down analysis? Open up a demo account here.
References
- TRADING ECONOMICS. (n.d.-d). United Kingdom Interest Rate – 2023 Data – 1971-2022 Historical – 2024 Forecast. https://tradingeconomics.com/united-kingdom/interest-rate. Accessed 5 March 2023.
- TRADING ECONOMICS. (n.d.-d). Japan Interest Rate – 2023 Data – 1972-2022 Historical – 2024 Forecast – Calendar. https://tradingeconomics.com/japan/interest-rate . Accessed 5 March 2023.


