
 Register
 Login
Login Register


Microsoft Q4 Preview: Can AI Growth Continue to Justify Record Spending?

Ludmila Insaurralde >
Market Analyst
Ludmila Insaurralde >
Market Analyst
 Updated Tue, 2026 July 28 08:44

Microsoft reports its Q4 FY2026 earnings after the US market closes on Wednesday, 29 July, with expectations running high following another quarter dominated by artificial intelligence.
Unlike previous years, investors are no longer asking whether Microsoft can beat earnings estimates it has consistently done so. Instead, the focus has shifted to a much bigger question:
Can Azure, Copilot and AI investment continue growing fast enough to justify Microsoft’s enormous spending on data centres?
With Microsoft now one of the largest companies in the world, even another earnings beat may not be enough unless management also delivers strong guidance for FY2027.
Microsoft Ups & Downs
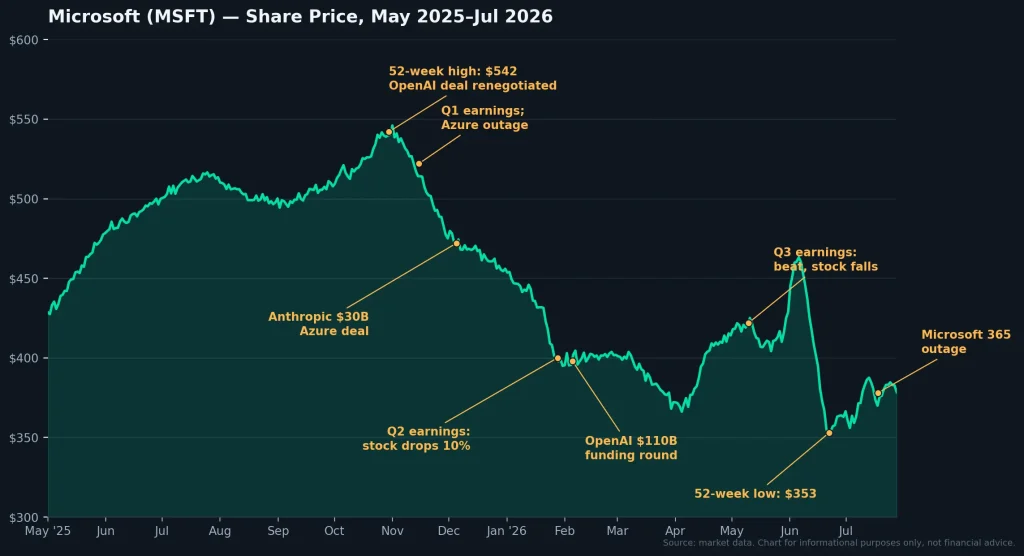
Microsoft keeps beating earnings expectations. The stock’s near a one-year low anyway. When the numbers are good but the price isn’t listening, that’s usually the more interesting story. Wednesday’s fiscal year-end results should tell us why.
The Q3 Baseline: Strong Growth, Higher Spending
Fiscal Q3 established a high operational baseline for Microsoft Q4 earnings 2026.
Azure grew 39% in constant currency, one percentage point above the previous quarter’s rate. Management said results exceeded expectations because Microsoft brought capacity online earlier than planned, enabling higher consumption across both AI and non-AI workloads. Demand remained greater than available supply across customer types, workloads, and geographic regions.
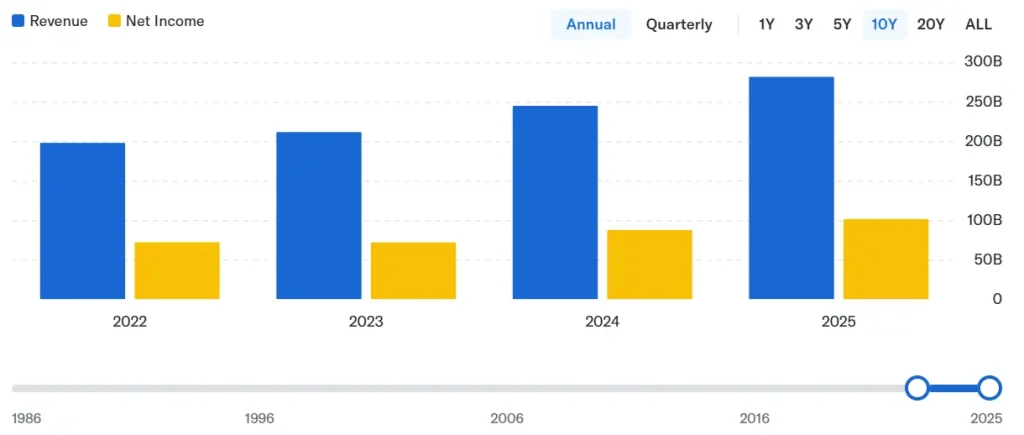
Core numbers: Wall Street is looking for roughly $87.7 billion in revenue (up ~15% year-on-year) and EPS of $4.24 (up 16%), per Yahoo Finance consensus estimates. That sits right at the top end of Microsoft’s own guided range of $86.7–87.8 billion, meaning expectations are for a result at the very best case the company itself flagged.
Technical Analysis: Has Microsoft’s Correction Run Its Course?
Microsoft’s chart tells a story of exhaustion followed by a fight-back. After peaking near $555 in mid-2025, the stock spent the back half of the year rolling over, and that slide didn’t stop at year-end. It’s now sitting roughly 25% YTD below where 2026 started, snapping a three-year winning streak in the process.
The real test came in late June, when price sliced through the $356.51 swing low set back in March. That breakdown didn’t spiral, though buyers stepped in around $349.20, a level that lines up closely with two older references worth watching: the $344.79 low from the April 2025 tariff-driven selloff, and a prior high near $349.67 from back in November 2021. When old resistance and old support cluster that tightly, it tends to matter.
What’s happened since is arguably the more important part: the rebound off that zone has been strong enough to push the stock back above its 200-week moving average, a trend line that typically only gets reclaimed when buying pressure is genuine, not just a dead-cat bounce. That doesn’t erase the downtrend, but it does take some of the more bearish scenarios off the table heading into Wednesday’s numbers
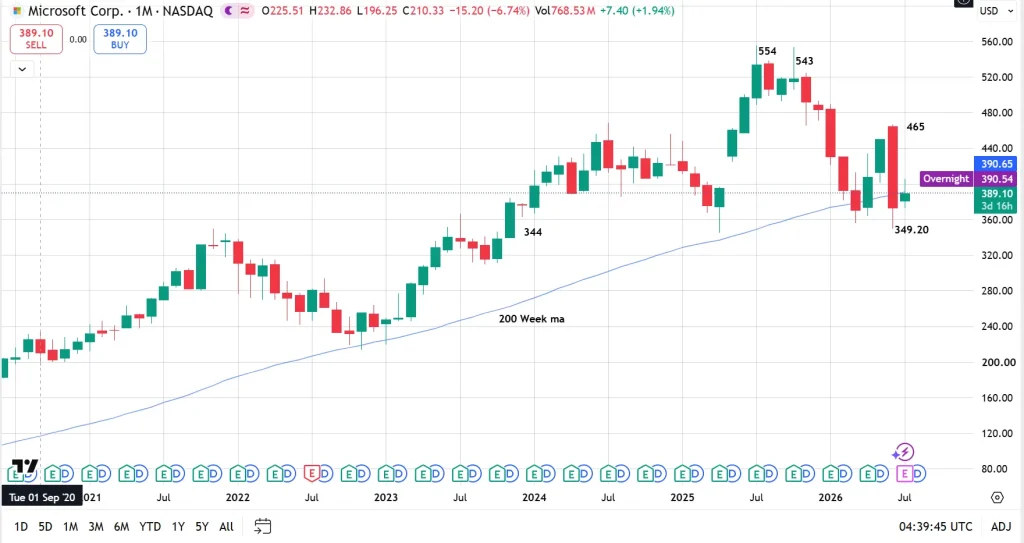
There are two ways this could play out from here. If Microsoft manages to hold the $345–$349 support band and backs it up with a solid earnings result, the path higher opens toward the 200-day moving average at $438.77, and potentially further, toward the $466.32 high set on 1 June.
On the flip side, a disappointing report that drags price through the $345–$349 zone on a sustained basis would likely shift the picture, with $280 becoming the next area of interest to the downside.
Summary
The business: Growing fast, spending faster. Azure’s running near 40% growth, revenue guidance points to ~17% full-year growth, and Microsoft hasn’t missed an earnings estimate in four quarters. But ~$190B in AI infrastructure spend is eating into free cash flow, and investors are still waiting for that spend to show up as clear returns — hence a pending class action over Copilot/Azure disclosures.
The AI bet: Big and getting bigger, a renegotiated OpenAI deal through 2032 ($250B Azure commitment), a $30B Anthropic partnership, and reports of Microsoft leasing extra compute from Amazon and Google just to keep up with demand. Alongside that, several rounds of layoffs and a voluntary retirement program suggest cost discipline elsewhere.
The stock: Down roughly 24–25% YTD, near a one-year low, despite the fundamentals holding up, a classic case of the market pricing in spending risk ahead of returns.
Disclaimer: The material provided here has not been prepared in accordance with legal requirements designed to promote the independence of investment research and as such is considered to be a marketing communication. Whilst it is not subject to any prohibition on dealing ahead of the dissemination of investment research we will not seek to take any advantage before providing it to our client. No representation or warranty is given as to the accuracy or completeness of this information and therefore it shouldn’t be relied upon as such. Any research provided does not have regard to specific financial situations, needs or investment objectives. Vantage accepts no responsibility for any use that may be made of these comments and for any consequences that result. Consequently, any person acting on it does so entirely at their own risk. We advise any readers of this material to seek professional advice where necessary. Without the approval of Vantage, reproduction or redistribution of this information isn’t permitted.
-

Open Trading Account
Discover the endless trading possibilities with our cutting-edge platform, designed to empower our traders. Practice trading the markets with a free demo account today.
-

Download Vantage App
Trade on the go with the Vantage All-In-One Trading App, where smooth execution and market access come together in the palm of your hand.
-

Start Trading
Are you an existing user? Login to your account to start trading 1,000+ CFD products including forex, indices, gold, shares and more.
