
 Register
 Login
Login Register


March Madness: when the Old Playbook Just Went Up in Smoke

Hebe Chen >
Senior Market Analyst
Hebe Chen >
Senior Market Analyst
 Updated Thu, 2026 March 26 06:38

March 2026 has been a masterclass in why markets hate a vacuum—especially one filled with smoke. As the tension in the Middle East dominated our feeds, the “sell everything first, ask questions later” reflex evolved into something far more clinical. If you’ve been watching the headlines this month or simply topping up your car with an eye-widening price tag, you’ve witnessed a massive repricing of global risk in real-time. Your portfolio is already on the front lines.
The Crisis Scorecard: Three Weeks of Reality
On February 28, US and Israeli strikes on Iran sent Brent crude surging 10–13% to around $80–82 per barrel within the first 72 hours. From March 3 to March 20, Brent surged from $78 to $107— a 30.7% move — while the S&P 500 fell roughly 4.5% over the same window.
The ASX 200 shed more than 9% from its early-March peak near 9,200 points, erasing roughly A$300 billion in market value— its worst two-week performance since June 2022. The sector split was brutal and instructive. Energy was the sole advancing sector among all eleven ASX categories, while materials bore the steepest losses, down 14%. In the Russia-Ukraine episode, commodities rallied broadly — iron ore, gold, and energy moved together.
The divergence between the market’s response to Iran War and Ukrainian War (as charts below) tells the whole story: the 2026 crisis playbook is not a conventional risk-off event. This was an energy shock wearing a geopolitical mask.
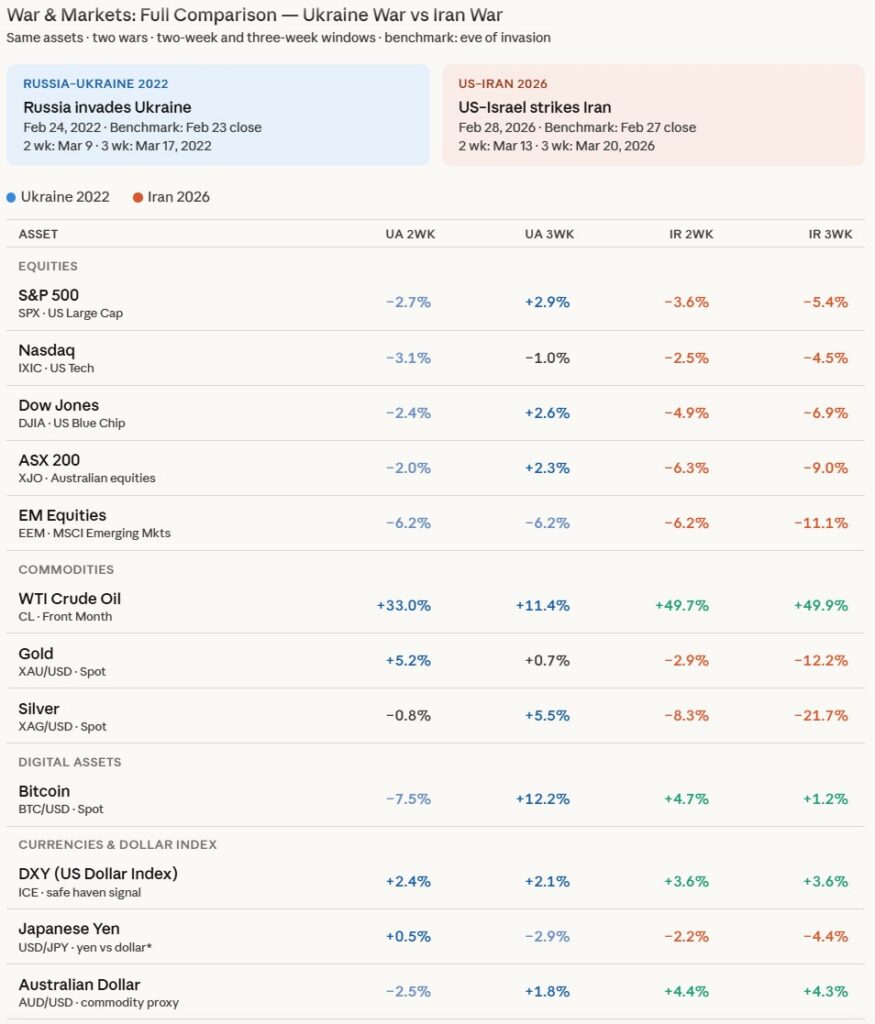
Data Source: Equity indices (S&P 500, Nasdaq, Dow, ASX 200, EM Equities) — Yahoo Finance
WTI Crude Oil— Macrotrends live WTI chart, Gold — Fortune daily gold price reports and Trading Economics, Silver — Fortune daily silver price reports , Bitcoin —Coinbase/Yahoo Finance historical data. DXY, USD/JPY, AUD/USD —Trading Economics
Re-evaluating the “Safe Haven”
For decades, the standard reflex was simple: in trouble, buy gold and bonds. In 2026, that reflex misfired.
Gold plummeted 12.2% by week three of the Iran crisis. Why? Because this isn’t just a flight to safety; it’s an inflation shock. Surging oil pushed rate-cut bets off the table, making yield-bearing assets more attractive than bullion. Meanwhile, the US Dollar (DXY) did what it does best under pressure, rising 3.6% as the ultimate liquidity refuge. The lesson? The “right” safe haven depends entirely on what’s on fire. When inflation is the accelerant, the “dusty” 60/40 playbook doesn’t offer much shelter.
The Long Tail: What Oil Prices Actually Mean From Here
The market has priced the headline shock. What it hasn’t fully priced is the second-order damage.
Roughly a third of global fertilisers ship through the Strait of Hormuz, and prices are already spiking — this isn’t just a trading story, it’s an earnings story that will hit agriculture, retail, and consumer staples across the next two reporting cycles.
Closer to home, back-to-back RBA hikes in February and March have brought the cash rate to 4.10%. An oil-driven inflation spiral is precisely what keeps a central bank’s trigger finger loaded — and capital costs elevated for every business in ASX.
What Do You Do Now?
Two scenarios, both with a trade.
A rapid de-escalation and reopening of the Strait would trigger a sharp risk-on rebound— miners and technology stocks, squeezed hardest in recent weeks, would likely lead the charge. If the conflict drags, the positioning is harder: stay close to energy, hedge currency exposure, and accept that “higher for longer” is no longer a forecast — it’s the baseline.
The Strait of Hormuz is 33 kilometres wide. It turns out that’s enough to reroute the entire world’s trading strategy.
Disclaimer: The material provided here has not been prepared in accordance with legal requirements designed to promote the independence of investment research and as such is considered to be a marketing communication. Whilst it is not subject to any prohibition on dealing ahead of the dissemination of investment research we will not seek to take any advantage before providing it to our client. No representation or warranty is given as to the accuracy or completeness of this information and therefore it shouldn’t be relied upon as such. Any research provided does not have regard to specific financial situations, needs or investment objectives. Vantage accepts no responsibility for any use that may be made of these comments and for any consequences that result. Consequently, any person acting on it does so entirely at their own risk. We advise any readers of this material to seek professional advice where necessary. Without the approval of Vantage, reproduction or redistribution of this information isn’t permitted.
-

Open Trading Account
Discover the endless trading possibilities with our cutting-edge platform, designed to empower our traders. Practice trading the markets with a free demo account today.
-

Download Vantage App
Trade on the go with the Vantage All-In-One Trading App, where smooth execution and market access come together in the palm of your hand.
-

Start Trading
Are you an existing user? Login to your account to start trading 1,000+ CFD products including forex, indices, gold, shares and more.
