[DAILY TRADING] EUR/USD, 19 June 2026 – Slides to Multi-Week Lows at 1.1420 After Hawkish Fed Surprise
Vantage Editorial Team >
Vantage Editorial Team >
Vantage is a global, multi-asset broker with a team of in-house writers and market analysts who produce educational and insightful trading content for traders of all levels.
![[DAILY TRADING] EUR/USD, 19 June 2026 – Slides to Multi-Week Lows at 1.1420 After Hawkish Fed Surprise](https://www.vantagemarkets.com/wp-content/uploads/2026/06/EURUSD_hero_8Jun2026.webp)
The EUR/USD pair fell to 1.1420 on 18 June 2026, its lowest level in several months, as the Federal Reserve under new chair Kevin Warsh delivered a hawkish pivot that strengthened the US dollar against most major currencies.[1]
As of 08:28 UTC on 19 June 2026, the Vantage EURUSD CFD is trading near 1.1458. Wednesday’s Federal Open Market Committee (FOMC) meeting left rates unchanged at 3.5%-3.75% but released a dot plot in which nine of 18 members project at least one hike before year-end, shifting the median 2026 rate forecast from 3.4% to 3.8%.[2]
This EURUSD analysis covers the chart structure, the macro drivers, and the key levels traders are watching. All prices reference the Vantage EURUSD CFD unless stated. This is not financial advice.
Key points
- EUR/USD fell roughly 180 pips over 17-18 June, hitting a low of 1.1420, after the FOMC dot plot showed nine members projecting a rate hike in 2026. The median year-end fed funds forecast shifted to 3.8% from 3.4%.[2]
- The European Central Bank (ECB) raised its deposit facility rate by 25 basis points to 2.25% on 11 June 2026, its first rate increase since September 2023, but the euro failed to sustain gains as President Lagarde declined to pre-commit to further tightening.[3]
- On the 15-minute chart, the 50-period MA (1.1507) sits above current price and the 200-period MA (1.1451) is close to where EUR/USD is trading now. The RSI (14) on the TradingView setup used for this analysis reads 65.24, while the RSI moving average reads 42.28, as of 08:28 UTC, 19 June 2026.
EUR/USD chart analysis: 15-minute view
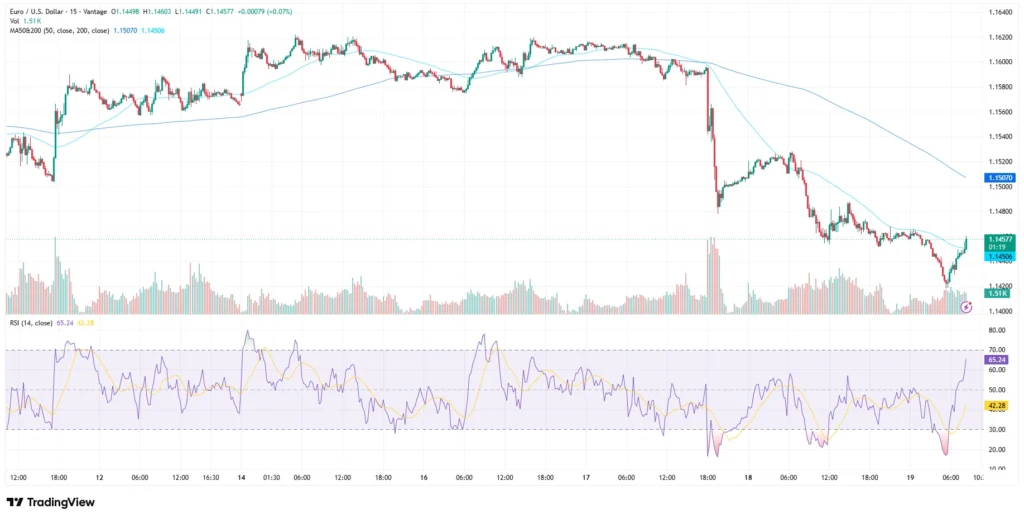
EUR/USD consolidated broadly between 1.1550 and 1.1610 from 11 to 16 June as traders positioned ahead of the Fed. The sell-off began on 17 June and accelerated on 18 June, with the pair dropping roughly 180 pips to the 1.1420 session low.
As of the time of writing, price is trading just above the 200-period MA (1.1451) and below the 50-period MA (1.1507). The 1.1550 zone that previously acted as support has flipped to resistance following the post-FOMC break. The RSI on the TradingView setup used for this analysis reads 65.24, above its moving average of 42.28, indicating improving short-term momentum following the rebound from the 1.1420 low.
What drove the EUR/USD sell-off
Wednesday’s FOMC meeting was Kevin Warsh’s first as Fed chair. The committee held rates at 3.5%-3.75% unanimously, but the accompanying dot plot and statement were notably more hawkish than markets had priced.[2]
Nine of 18 members project a rate hike before year-end, with six of those expecting two hikes. The median 2026 Fed funds forecast rose to 3.8% from 3.4% in March 2026. The FOMC’s PCE inflation projection for year-end was revised sharply higher, from 2.7% in March to 3.6%, driven partly by elevated energy costs linked to the ongoing Middle East conflict.[4]
Warsh also stripped the statement of prior language signalling a cut bias, and declined to submit his own dot, consistent with his stated scepticism of forward guidance. The cumulative message pulled US short-dated Treasury yields higher, widening the rate differential against the euro.[2]
On the ECB side, the 25-basis-point hike on 11 June 2026 to 2.25% had already been priced in. Lagarde’s neutral-to-mildly-hawkish tone at the press conference stopped short of pre-committing to further increases, limiting the euro’s ability to absorb the subsequent dollar bid.[3]
Key EUR/USD levels
| Level | Price | Context |
| Resistance 2 | 1.1550 | Prior consolidation ceiling, 12-16 June 2026 range top |
| Resistance 1 (MA50) | 1.1507 | 50-period MA on 15-min chart, above current price |
| Current price | 1.1458 (08:28 UTC, 19 Jun) | Vantage EURUSD CFD; near 200-period MA (1.1451) |
| Support 1 | 1.1420 | Session low from 18 June post-FOMC sell-off |
| Support 2 | 1.1410 | 2026 year-to-date low set 16 March 2026 (InvestingLive, 18 June 2026) |
Table 1: Key EURUSD levels as of 08:28 UTC, 19 June 2026. Sources: Vantage EURUSD CFD, TradingView. Indicative only.
What to watch for EUR/USD this week
- US PCE inflation, 27 June 2026: The Fed now projects PCE at 3.6% by year-end. A hotter-than-expected print would reinforce the hawkish dot plot and keep upside pressure on the dollar versus the euro.[4]
- Eurozone CPI flash, late June 2026: Eurozone inflation ran at 3.2% in May 2026. The trajectory here shapes whether markets price a second ECB hike later in 2026.[3]
- Middle East conflict developments: Energy price movements from the region continue to feed directly into inflation forecasts on both sides of the Atlantic and remain a live variable for the EUR/USD outlook.
- FOMC minutes, ~mid-July 2026: Markets will scrutinise the balance between officials projecting further tightening and those expecting rates to remain unchanged, for clues on the timing and scale of any potential move.
Market participants often monitor Stop Loss placement relative to the structural levels above. EUR/USD moved roughly 180 pips in two sessions; intraday range assumptions that held earlier in the week may not reflect the current environment. The 1.1420 session low and the 1.1507 MA50 are the levels market participants are treating as primary references on either side of the current range.
Leverage works in both directions. In a data-sensitive, event-driven period like the current one, rapid moves in EUR/USD can amplify outcomes quickly. Reviewing position sizing relative to your account balance is particularly relevant ahead of the 27 June PCE print.

RISK WARNING: CFDs are complex financial instruments and carry a high risk of losing money rapidly due to leverage. You should ensure you fully understand the risks involved and carefully consider whether you can afford to take the high risk of losing your money before trading.
Disclaimer: The information is provided for educational purposes only and doesn’t take into account your personal objectives, financial circumstances, or needs. It does not constitute investment advice. We encourage you to seek independent advice if necessary. The information has not been prepared in accordance with legal requirements designed to promote the independence of investment research. No representation or warranty is given as to the accuracy or completeness of any information contained within. This material may contain historical or past performance figures and should not be relied on. Furthermore estimates, forward-looking statements, and forecasts cannot be guaranteed. The information on this site and the products and services offered are not intended for distribution to any person in any country or jurisdiction where such distribution or use would be contrary to local law or regulation.
References
[1] “EUR/USD exchange rate fell to 1.1466 on June 18, 2026 – Trading Economics” https://tradingeconomics.com/euro-area/currency Accessed on 19 June 2026.
[2] “Fed interest rate decision June 2026: Fed holds rates steady – CNBC” https://www.cnbc.com/2026/06/17/fed-interest-rate-decision-june-2026.html Accessed on 19 June 2026.
[3] “Monetary policy decisions – European Central Bank” https://www.ecb.europa.eu//press/pr/date/2026/html/ecb.mp260611~4d41bd5e83.en.html Accessed on 19 June 2026.
[4] “June FOMC: Fed holds interest rates steady as Warsh era begins – Fox Business” https://www.foxbusiness.com/economy/federal-reserve-interest-rate-decision-june-17-2026 Accessed on 19 June 2026.
[5] “Fundamental Market Analysis for June 19, 2026 (EURUSD) – MQL5” https://www.mql5.com/en/blogs/post/771713 Accessed on 19 June 2026.
[6] “EURUSD moves to a new low and digs into swing area target – InvestingLive” https://investinglive.com/technical-analysis/eurusd-moves-to-a-new-low-and-20260618/ Accessed on 19 June 2026.
